How to Track Stablecoin Supply, Flows, and Institutional Activity in Allium Terminal


Ask most blockchain data dashboards how big the stablecoin market is and you'll get a market cap number and a transfer volume number. Ask them who's actually moving that money — a consumer sending remittances, a market maker rebalancing, or a bank settling a treasury payment — and most go quiet.
The distinction between how much money is moving and where the money is actually going is exactly what institutional teams evaluating stablecoins need.
Stablecoin attribution is the classification of a stablecoin transfer by counterparty type (consumer, business, or institutional) and use case (payment, trade, or store of value), rather than by raw dollar volume alone. Stablecoin attribution is the layer that turns a transfer amount into a signal about who's actually active in the market.
Generic onchain data aggregators collapse all stablecoin data into one volume figure. A single stablecoin transfer of $50 million could be a corporate settlement or a bot wash-trading on a DEX, and from the outside they look identical. Allium Terminal separates supply, transfer activity, and counterparty type into filterable dashboards, so you can answer "how much" and "who,” all without the need to write any code.
This walkthrough covers where to find stablecoin market cap and issuer concentration, how to break transfers down by wallet type, and why the institutional footprint in stablecoins is easy to undercount if you're only looking at transaction volume.
Key takeaways
- Stablecoin supply is concentrated in a small number of issuers and two dominant settlement chains.
- Raw transfer volume treats a bot trade and a treasury settlement as the same event.
- Institutional stablecoin activity is easier to identify by transaction size than by transaction count.
- Allium Terminal's wallet-type and payment-category filters do this classification without requiring a query.
What Is Allium Terminal's Stablecoin Market Cap Right Now?
Step 1: Open the Stablecoin Overview Dashboard
In Allium Terminal, the Stablecoins section has its own Overview dashboard, separate from Issuance, Transfers, Holders, and DeFi tabs. With the Supply Type filter set to Native (canonical issuer deployments, excluding bridge-wrapped duplicates) and no chain or stablecoin filter applied, the Market Cap card shows a combined stablecoin market cap of $303.24 billion as of July 2026.
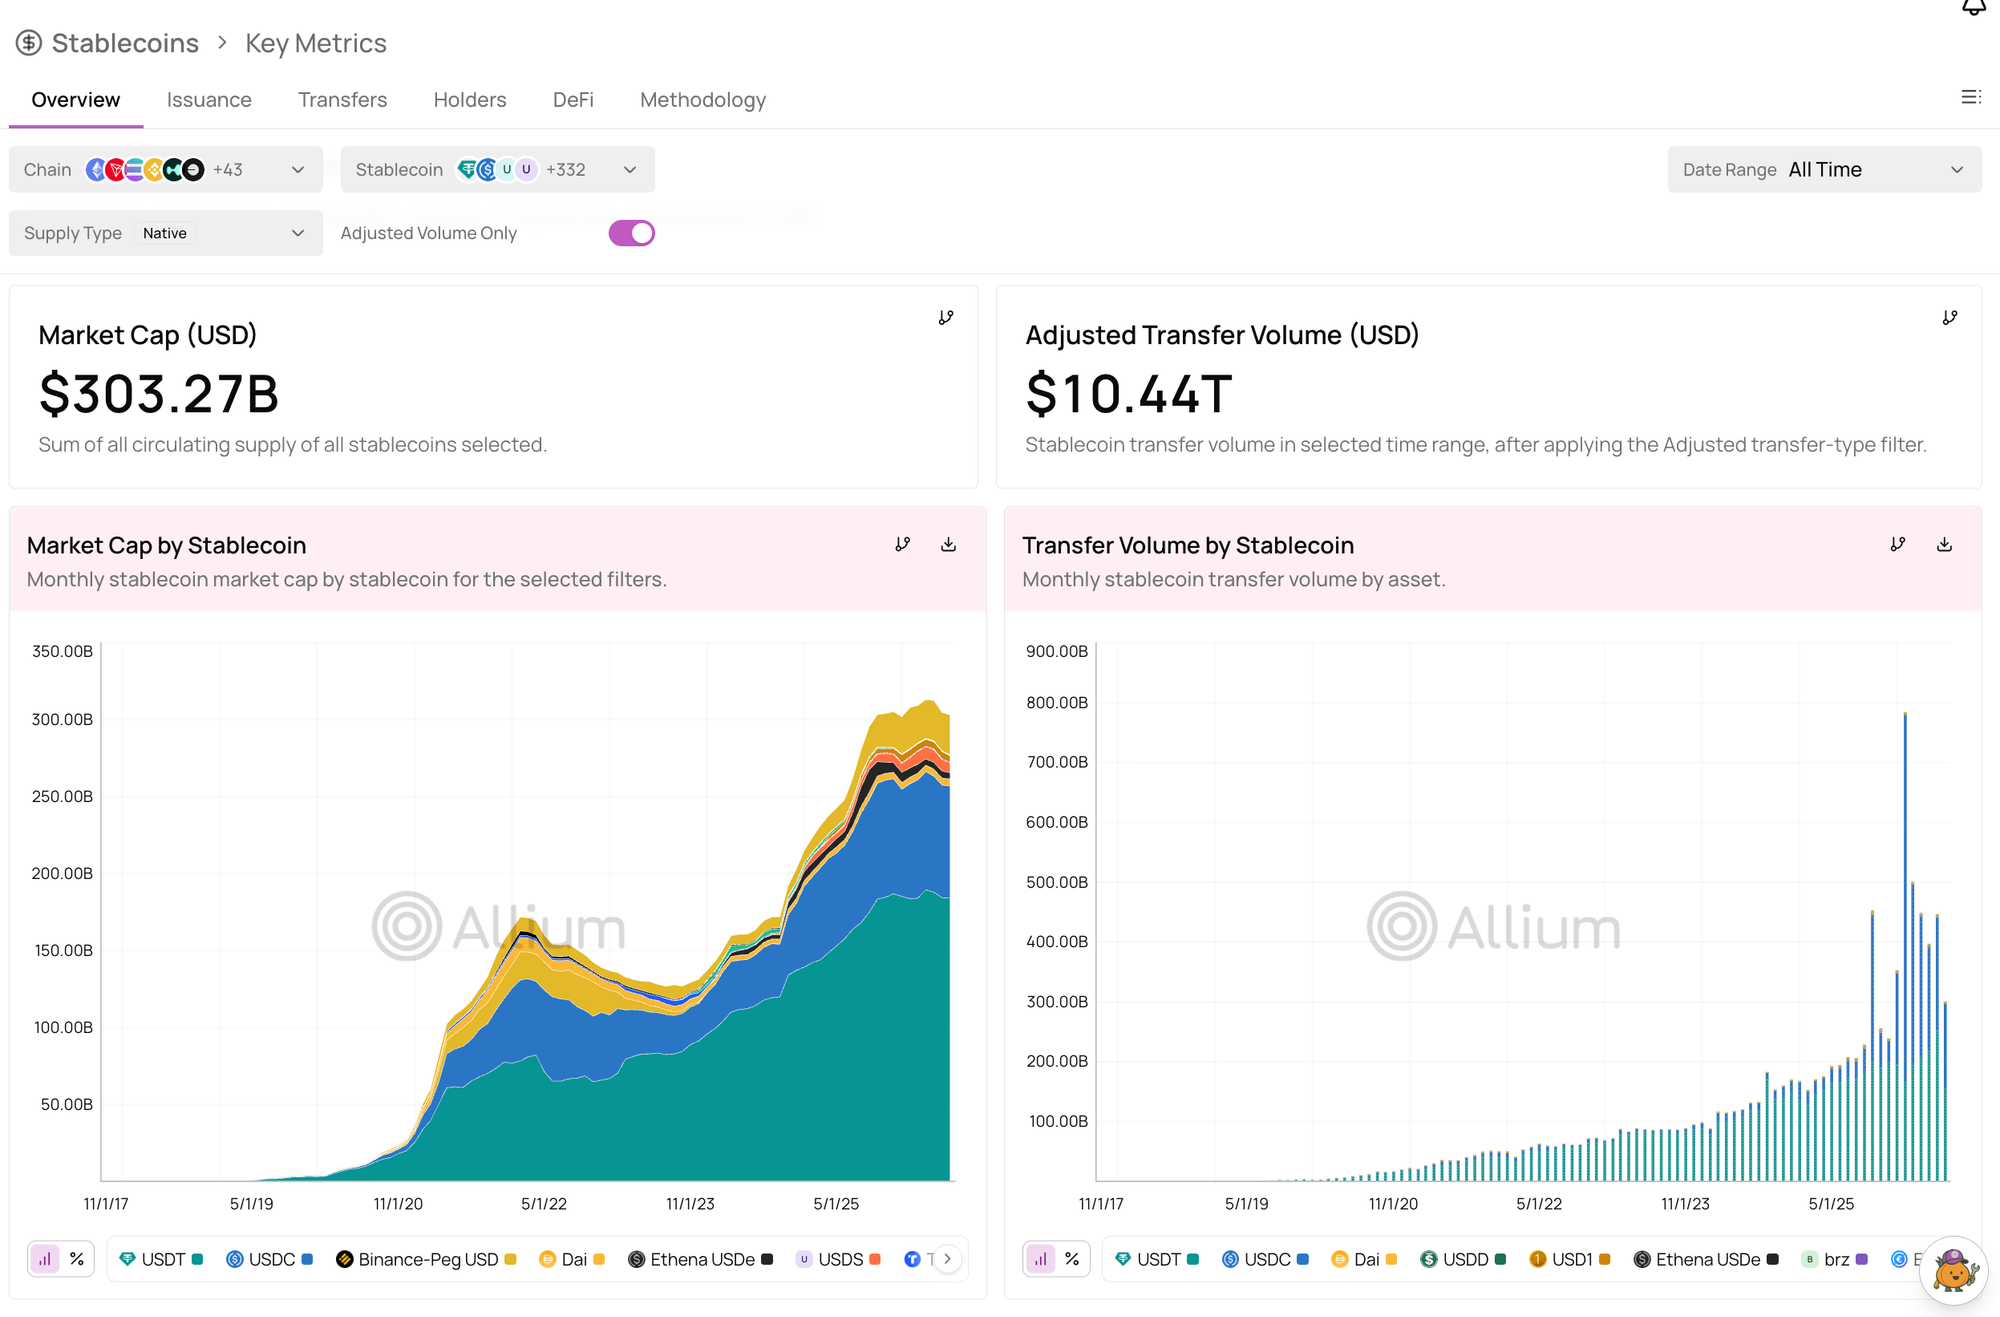
That figure covers every fiat-pegged stablecoin Allium tracks, not only dollar-pegged ones. Scoped to USD-pegged, natively-issued stablecoins specifically — the slice most relevant to institutional dollar-settlement use cases — Allium Terminal data puts circulating supply at $301.6 billion as of July 19, 2026, up from $255.0 billion a year earlier. That's 18.3% year-over-year growth in USD-pegged native supply, though supply was down slightly (-1.7%) from a month earlier, a reminder that stablecoin supply isn't a one-way climb even in a growth year.
Which Issuers and Chains Actually Hold the Supply?
Supply concentration is steep at the top.
Among USD-pegged native stablecoins as of July 19, 2026:
USDT and USDC alone account for roughly 85% of USD-pegged native supply. Chain concentration follows a similar pattern:
Ethereum and Tron together hold over 86% of tracked USD-pegged native supply. For an institution evaluating settlement infrastructure, that concentration matters more than the long tail: liquidity, custody support, and compliance tooling are deepest on the chains where the supply already sits.
Why Doesn't Total Transfer Volume Tell You Who's Actually Using Stablecoins?
Volume answers "how much moved,” but it doesn't answer "was that a trade, a payment, or a treasury transfe.” All of these have different implications for liquidity risk, compliance exposure, and product strategy. This is why raw stablecoin volume is increasingly treated as an incomplete signal on its own — attribution classifies transactions by counterparty and use case instead of treating all volume as equivalent.
Step 2: Break Transfers Down by Wallet Type
Allium Terminal's Attribution section includes a Payment Use Cases dashboard that segments stablecoin flows by sender and receiver wallet type — Consumer, Business, or Institutional — using behavioral pattern analysis, entity labels, and cross-referencing against external data sources.
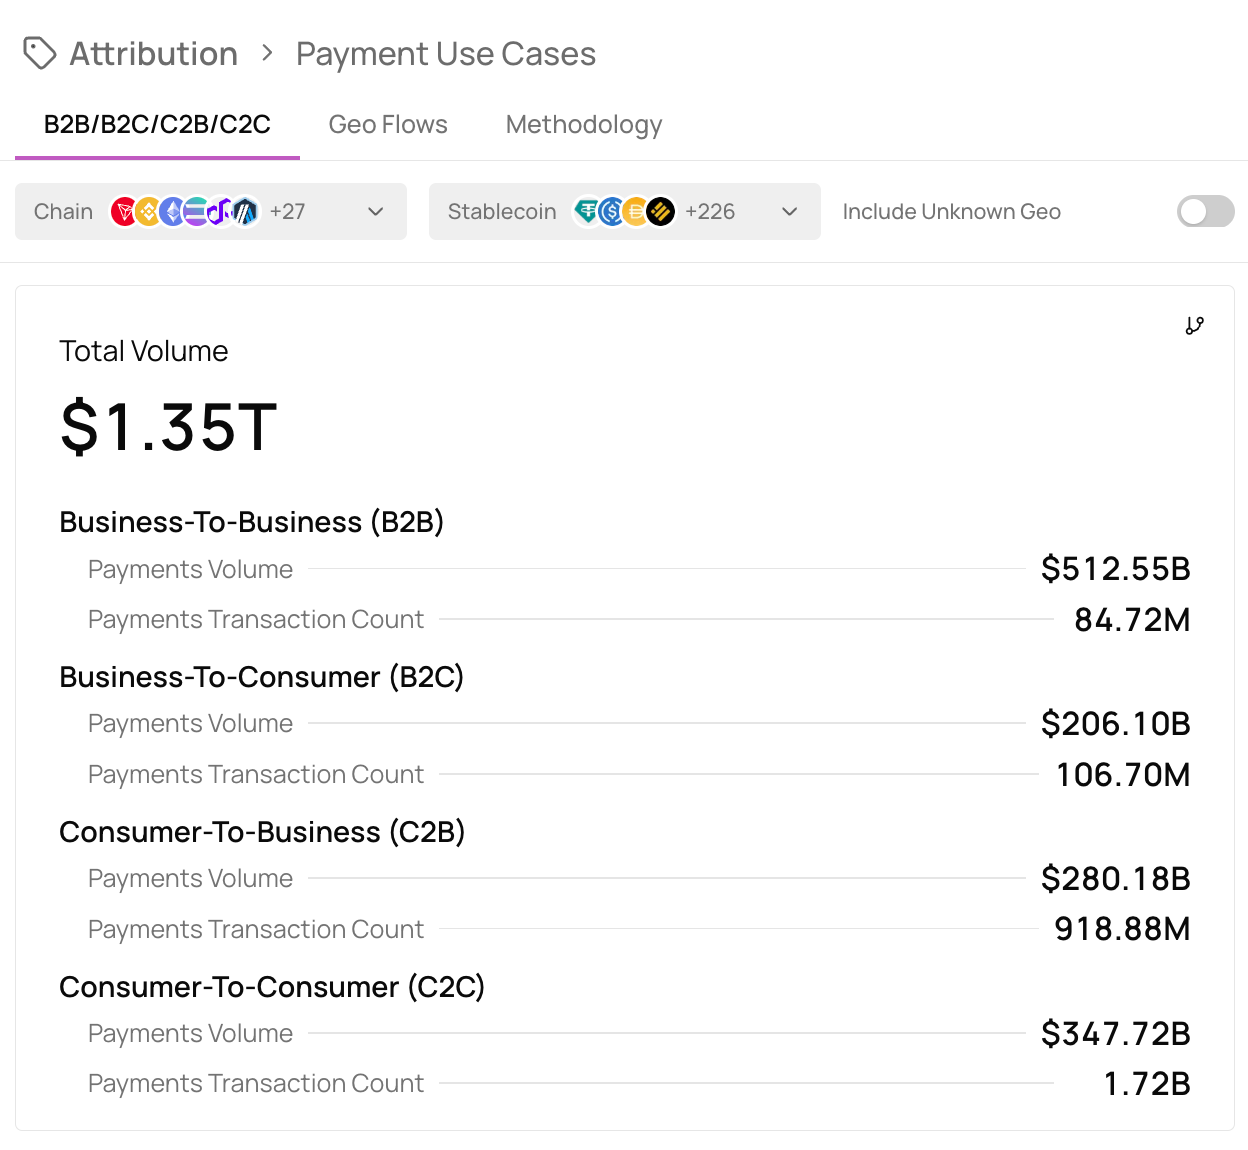
To see just a single day of activity, you can use Allium Explorer to break down each class of stablecoin transfer.
Source: Allium Terminal and Explorer, July 17, 2026
Real-world payments accounted for the largest share of transactions that day (4.37 million) but the smallest share of dollar volume among classified categories. Investment and trading activity moved nearly three times as much value in a fraction of the transaction count — the clearest evidence that transaction count and dollar volume tell very different stories about stablecoin usage.
Trading, Saving, and Spending Look Nothing Alike On-Chain
Breaking that same day down by counterparty pairing (sender-to-receiver wallet type) shows where the volume actually concentrates:
Source: Allium Terminal, July 17, 2026
C2C activity dominates transaction count by a wide margin, which is exactly what you'd expect from consumer remittances and peer transfers. But look at average transaction size instead of count, and the pattern flips.
How Do You Spot Institutional Stablecoin Activity When It's a Small Share of Transactions?
Step 3: Isolate Institutional-to-Institutional and Deposit Flows
Within the payment-specific taxonomy, institutional counterparties show up under a handful of labels: I2C Payment, I2B Payment, Institutional Payment (I2I), and Deposit to Institutional (consumer or business funds flowing into an institutional wallet).
On July 17, 2026, those categories broke down as:
Source: Allium Terminal, July 17, 2026
Ticket Size, Not Transaction Count, Is the Institutional Signal
Add up every label that explicitly says "institutional" as a counterparty in a payment (I2C Payment, I2B Payment, and Institutional Payment) and you get about $28.6 million — under 1% of that day's $3.04 billion in real-world payment volume. Read only that number, and institutions look nearly absent from stablecoin payments.
That reading misses where the real institutional footprint sits. Deposit to Institutional — consumer and business wallets sending funds into institutional wallets, the pattern you'd expect from custody, exchange settlement, or treasury operations — moved $456.8 million that day, about 15% of real-world payment volume and sixteen times the volume explicitly labeled "institutional payment."
And outside the payment taxonomy entirely, institutional-to-institutional transfers averaged roughly $325,161 per transaction, against roughly $2,428 for consumer-to-consumer transfers — about a 134x difference in typical transaction size.
Institutional stablecoin activity, in other words, doesn't announce itself as a labeled "institutional payment." It shows up as a small number of very large transfers and as inbound flows into institutional-type wallets.
Anyone sizing institutional stablecoin usage from transaction counts alone — or from a label that says "institutional" — will undercount it substantially. This is the same gap major banks and consultancies have had to correct for in their own published research: OCBC adjusted 2024 stablecoin transaction volume down from over $26 trillion unfiltered to roughly $5.5 trillion after removing high-frequency trading, bots, and internal transfers, using Visa-Allium data. Headline volume and real economic activity are not the same number, and closing that gap requires exactly this kind of counterparty-aware breakdown.
Do You Need SQL to Run This Stablecoin Analysis on Allium Terminal?
No, SQL isn’t needed on Allium Terminal.
Every dashboard referenced above — Stablecoin Overview, Payment Use Cases, and the underlying wallet-type and payment-category filters — is accessible through Allium Terminal's UI with dropdown chain, stablecoin, and date-range filters. No SQL or code is required to reproduce the market cap, issuer, chain, or wallet-type breakdowns in this piece.
What Allium’s Stablecoin Data Actually Tells You
Two things worth taking away from our quick dive into stablecoin data on Allium Terminal.
First, stablecoin supply is concentrated — in USDT and USDC, and in Ethereum and Tron — which means liquidity and infrastructure decisions should follow that concentration rather than the long tail of smaller issuers and chains.
Second, institutional stablecoin activity is real but structurally under-labeled: it shows up in transaction size and in deposit flows into institutional wallets far more than in transaction counts or explicit "institutional payment" tags. Any institutional analysis of stablecoin usage that stops at aggregate volume or transaction counts will misread both how big the market is and who's actually driving it.
FAQs About Stablecoin Tracking in Allium Terminal
What is Allium Terminal's total stablecoin market cap?
Allium Terminal's Stablecoin Overview dashboard showed a combined market cap of $303.24 billion across all tracked fiat-pegged stablecoins as of July 2026, using the Native supply-type filter.
How does Allium Terminal classify stablecoin transactions by wallet type?
Allium Terminal assigns each stablecoin transfer's sender and receiver a wallet type — Consumer, Business, or Institutional — based on behavioral pattern analysis, entity labels, and cross-referencing against external data sources, then uses that pairing (e.g., C2C, B2I, I2I) to classify the transaction's likely use case.
What's the difference between stablecoin transfer volume and stablecoin attribution?
Transfer volume is a single dollar figure that treats every transaction the same regardless of who sent it or why. Stablecoin attribution breaks that volume down by counterparty type and use case — payment, trade, or store of value — so a $50 million treasury settlement isn't counted the same as $50 million in bot-driven trading volume.
Which chains hold the most stablecoin supply?
As of July 19, 2026, Ethereum held the largest share of tracked USD-pegged native stablecoin supply at $168.4 billion, followed by Tron at $91.3 billion, according to Allium Terminal data.
Which stablecoins have the largest circulating supply?
USDT led USD-pegged native stablecoin supply at $184.1 billion as of July 19, 2026, followed by USDC at $72.9 billion, according to Allium Terminal data.
Do you need SQL to see institutional stablecoin activity in Allium Terminal?
No, you don’t need SQL. Wallet-type and payment-category breakdowns are available through Allium Terminal's Attribution and Payments dashboards using dropdown filters, without writing SQL.
Why does institutional stablecoin activity look small in raw transaction counts?
Because institutions make far fewer, far larger transfers than consumers. On one sampled day, institutional-to-institutional transfers averaged roughly $325,161 each against roughly $2,428 for consumer-to-consumer transfers. Institutional activity is easy to undercount if you're only looking at transaction counts rather than transaction size.
What is "Deposit to Institutional" in Allium Terminal's payment categorization?
“Deposit to Institutional” is a payment category for consumer or business wallets sending stablecoins into a wallet classified as institutional — the pattern typical of custody deposits, exchange settlement, or treasury operations — and it moved more volume than any category explicitly labeled "institutional payment" in Allium's sampled data.