Polymarket vs. Kalshi: How to Compare Open Interest Using Onchain Data

If you’re curious about the differences between Polymarket and Kalshi, a quick Google search may or may not answer your question. Top of the search engine are interviews with the Kalshi CEO, news reports about prediction market regulation, and ads to onboard new users to start predicting.
And even though the AI answers can give more real information about Polymarket and Kalshi numbers, each fact is sourced from a different site: there’s no way to easily confirm that the data is up-to-date and accurate.
If you have a real data question about Polymarket and Kalshi and their open interest (or any other onchain data), you need a specific onchain analytics platform like Allium Terminal.
This walkthrough will answer the question you’re really looking for: where is capital actually deployed, and how do you measure it? Open interest is the right signal: while volume tells you how much trading happened, open interest tells you how much conviction is live.
Below is a guide on how to pull and compare open interest across Polymarket, Polymarket US, and Kalshi using Allium Terminal.
What Data Do You Need to Compare Polymarket and Kalshi?
Allium Terminal’s prediction markets dashboard covers all major prediction markets in a single view. It tracks Polymarket, Polymarket US, Kalshi, and several other platforms using a consistent methodology, so metrics are directly comparable across all venues.
One thing to keep in mind: Polymarket and Polymarket US are distinct platforms due to regulatory constraints in America. The dashboard tracks them separately.
Which Platform Has More Open Interest: Polymarket or Kalshi?
Step 1: Start with today's market snapshot
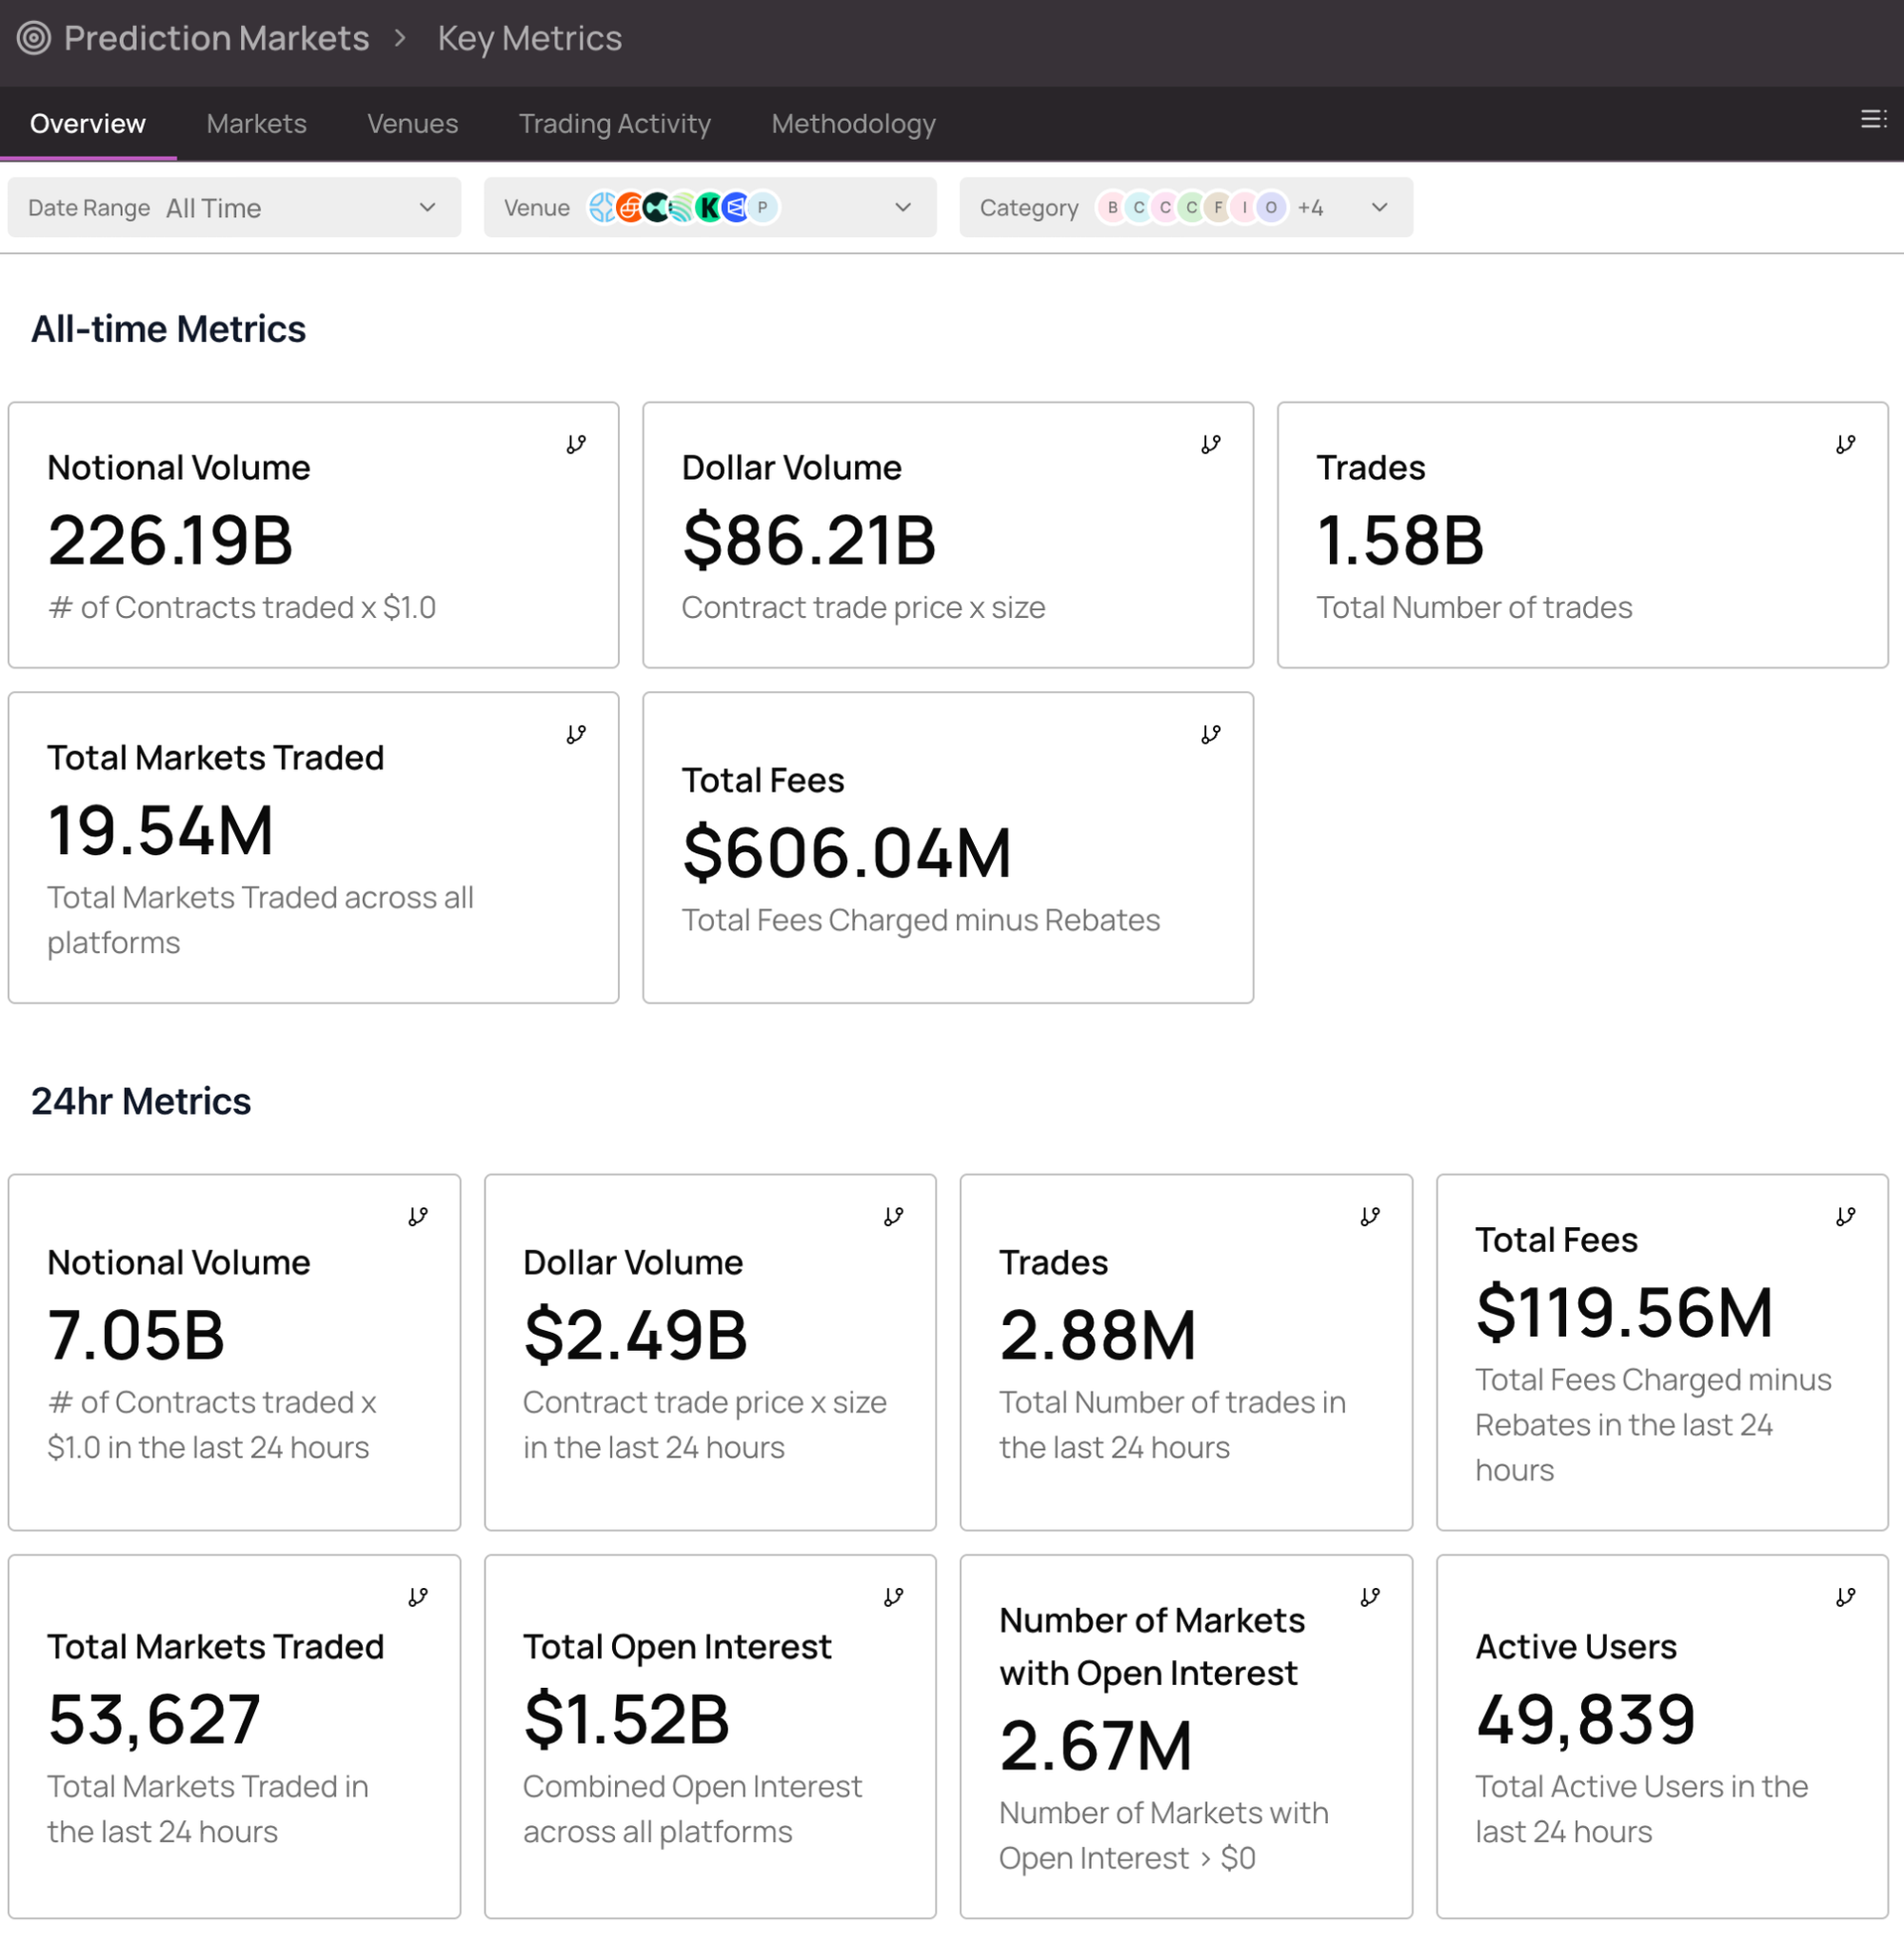
Allium Terminal’s Overview tab has flexibility in selecting a date range for the metrics: readily available are “all time” and “24hr,” but you can get more granular by choosing a custom date range as well. For the purposes of this walkthrough, we will look at the 24hr section.
Today, this shows the following:
Total open interest: $1.52 billion combined across all platforms
Number of markets with open interest: 2.67M markets with capital currently deployed
Active users: 49,839 active users
Step 2: Compare capital committed over time
You’ll find an open interest chart on the same overview page, showing a stacked area chart with all open interest across all prediction markets since September 2024. Since Kalshi (green) and Polymarket (blue) are the largest, it’s possible to compare the two visually from this chart.
For more information about any of the spikes or valleys in open interest for these two platforms, it’s possible to zoom in as granularly as hourly or per minute, as well as daily, per month, and per year.
A quick analysis of this chart set to the past year tells you the following:
- Kalshi (green) forms the base layer and holds the largest share of open interest
- Polymarket (blue) stacks on top and has been growing steadily — the two platforms are set to converge in 2026 if the trajectory continues
- Polymarket US (light blue) is just a small sliver, reflecting its small scale relative to the other two venues
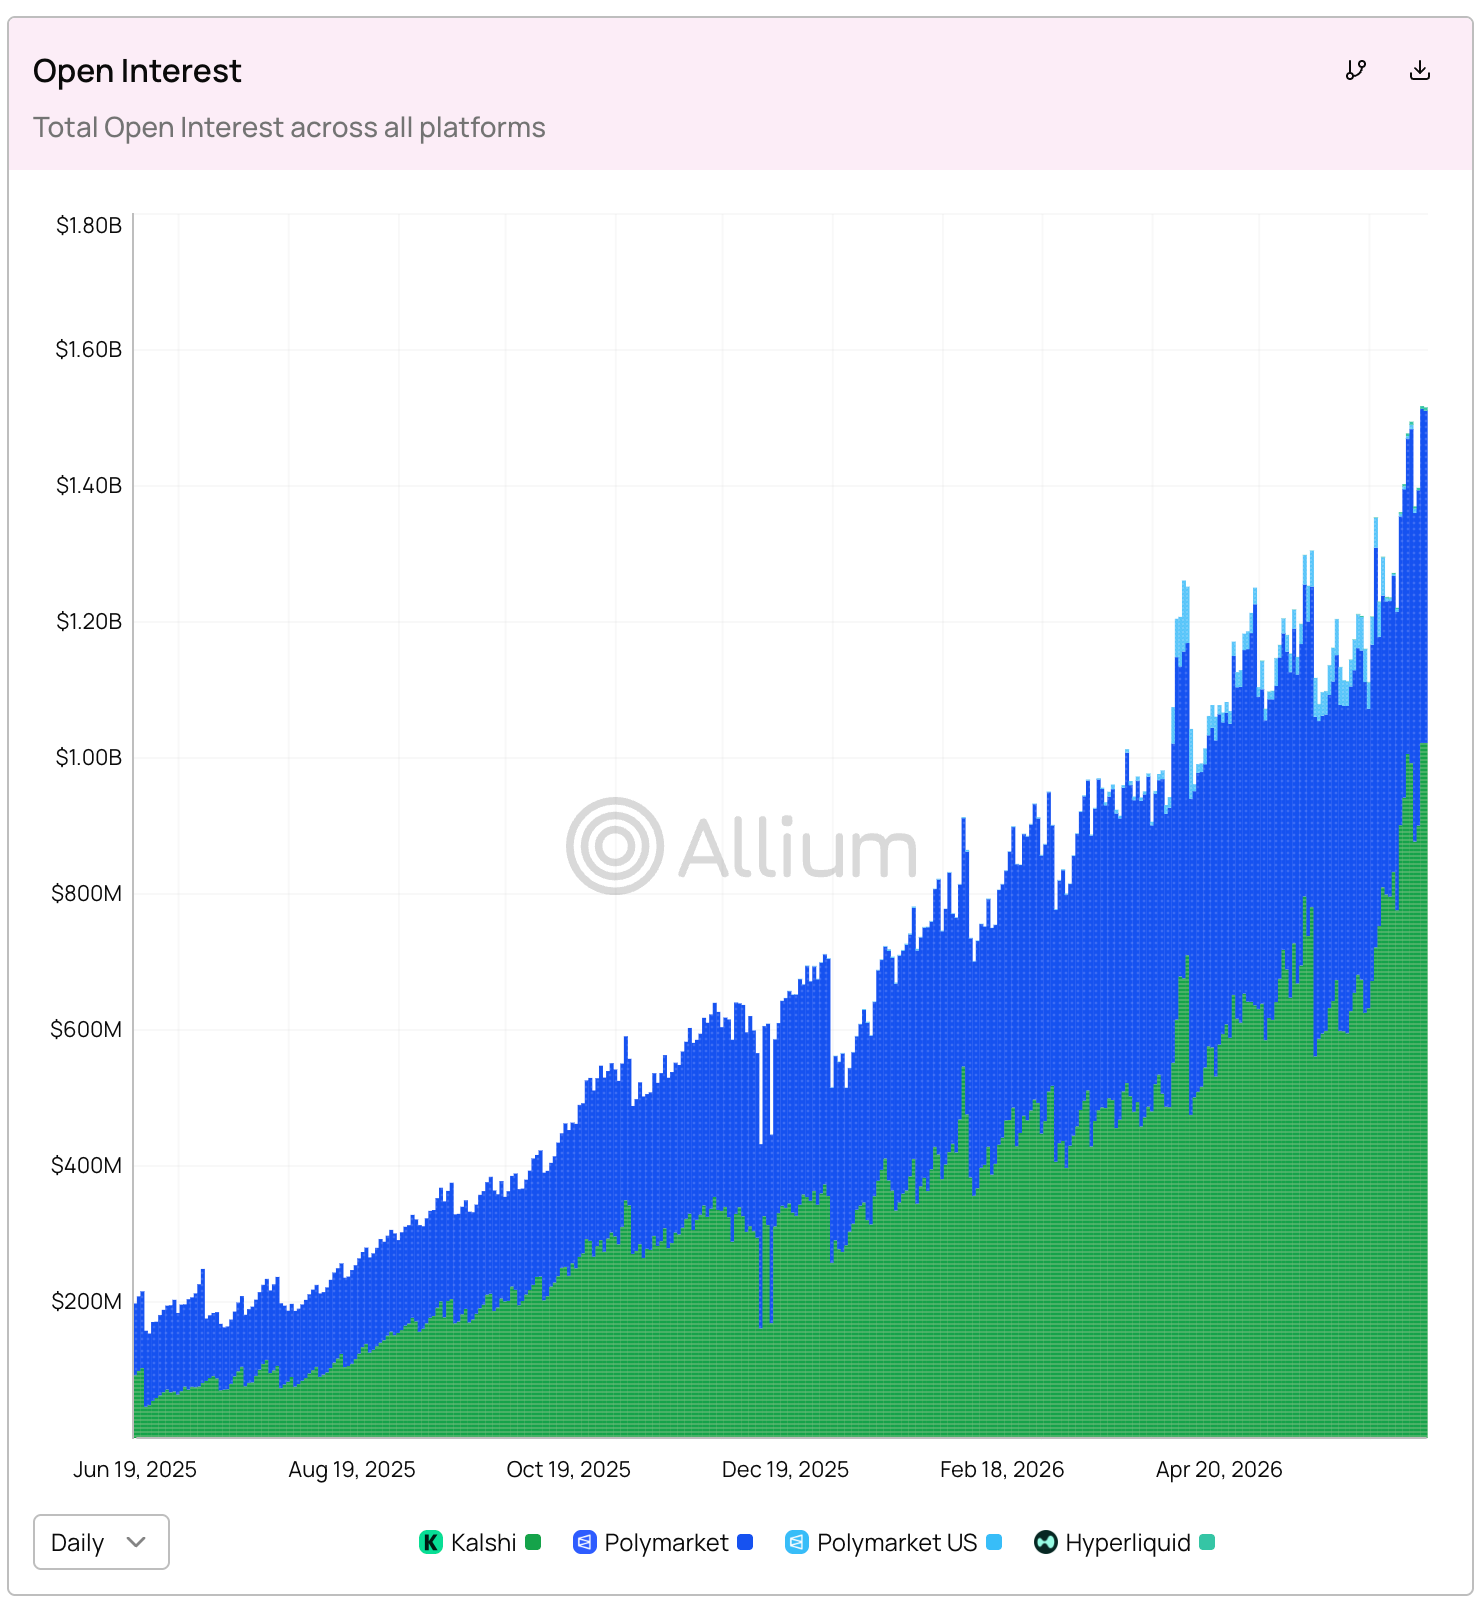
For broader context, it’s important to note that prediction market open interest is event-driven. If you look at the all-time view, you will see a large spike around the 2024 US presidential election, with open interest peaking around $900M before dropping sharply after resolution. Kalshi’s steadier baseline throughout reflects the broader market mix of popular events on its platforms — financial events, ports, economic data — which don’t resolve in the same concentrated burst as an election.
Which Categories Generate the Most Open Interest?
Step 3: Identify where conviction concentrates
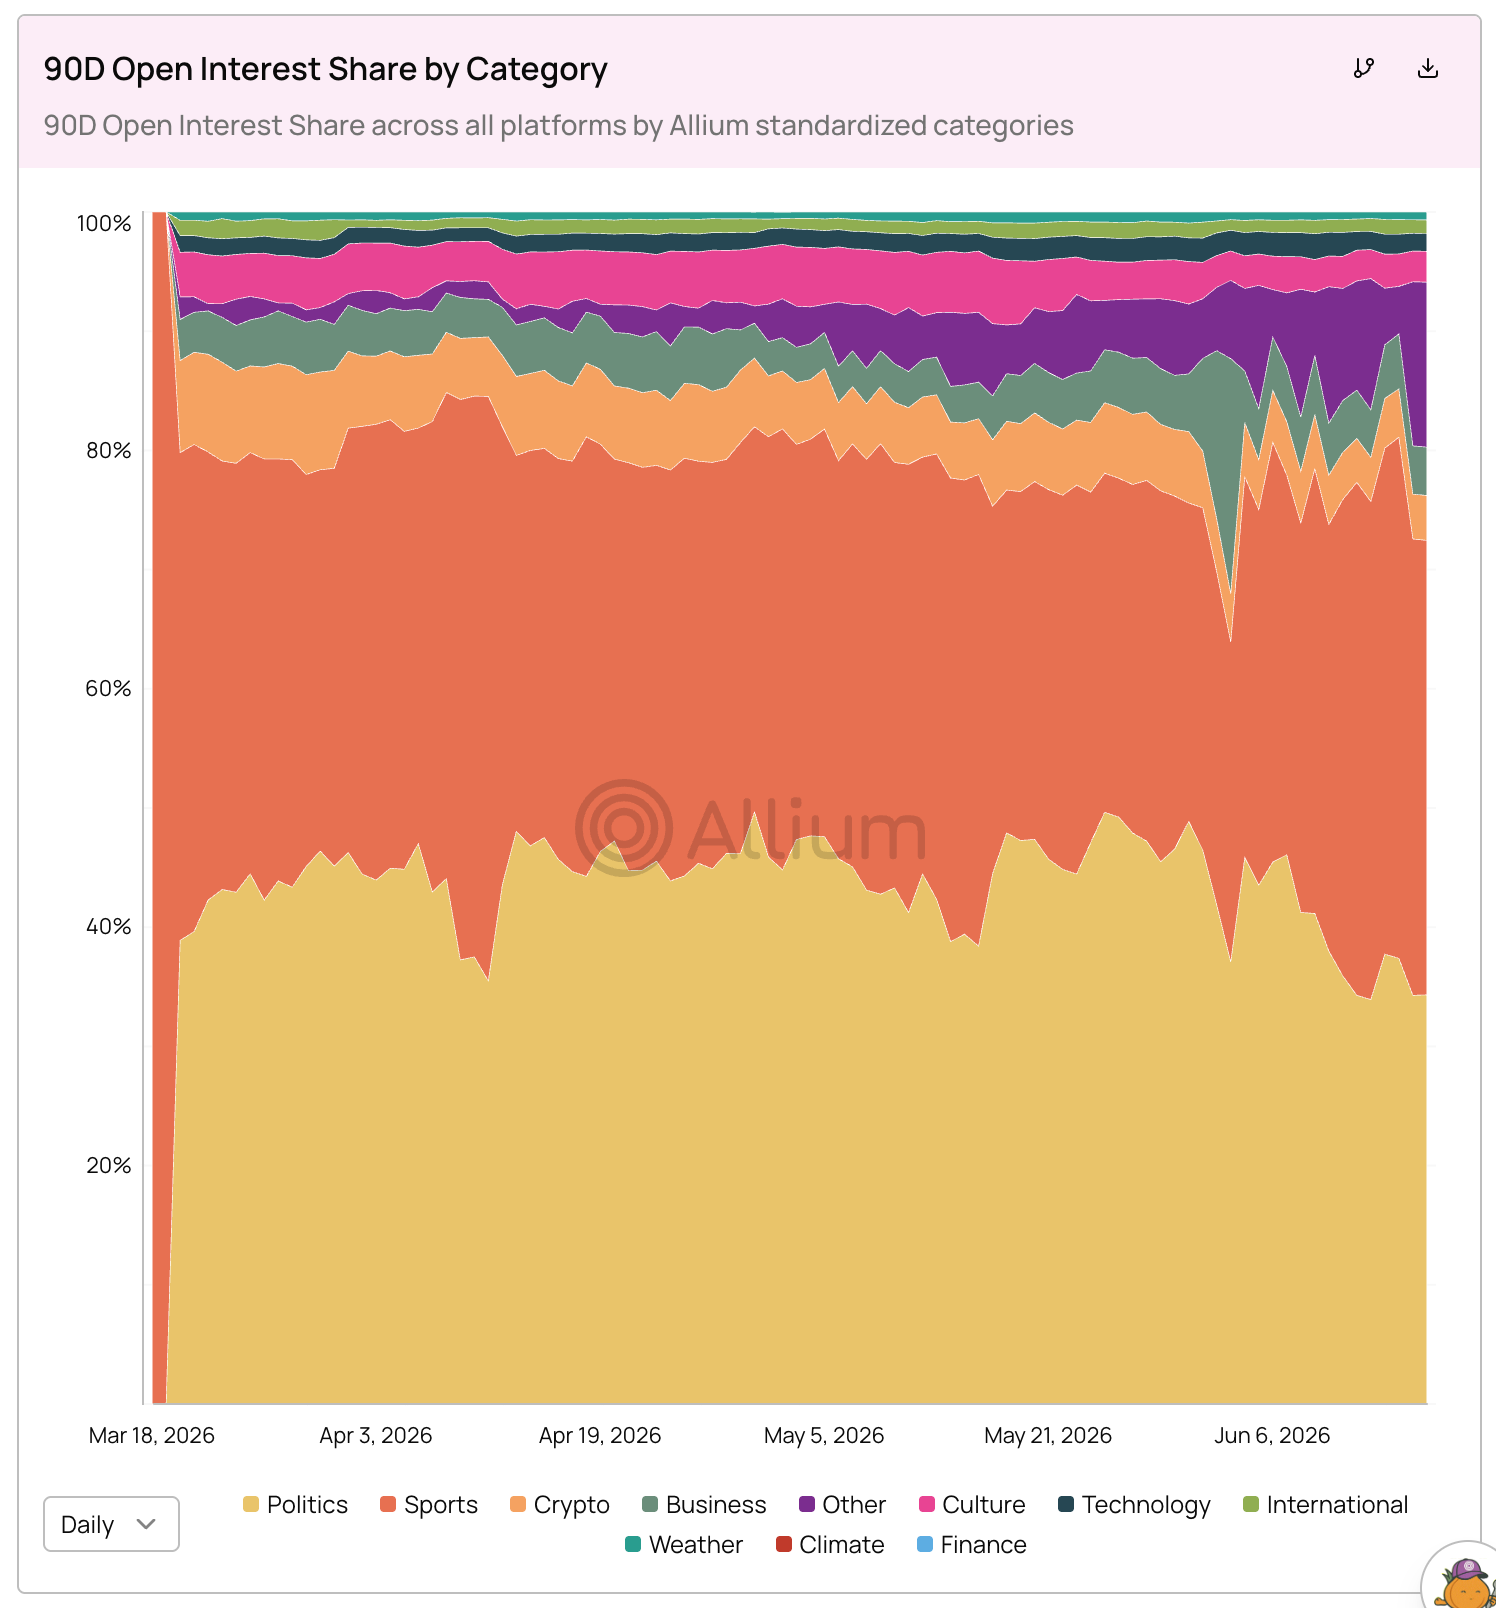
Further down on the page, the 90D open interest share by category chart shows how open interest has been distributed across market types.
Politics (yellow) holds the largest share — consistently 35-50% of total open interest — reflecting the structural importance of long-dated political markets to both Kalshi and Polymarket. Sports (dark orange) has grown after Kalshi entered the sports betting market before last year’s Super Bowl. Crypto markets hold a smaller but consistent share.
How Has Open Interest Changed Over Time?
Step 4: Measure how the market evolved
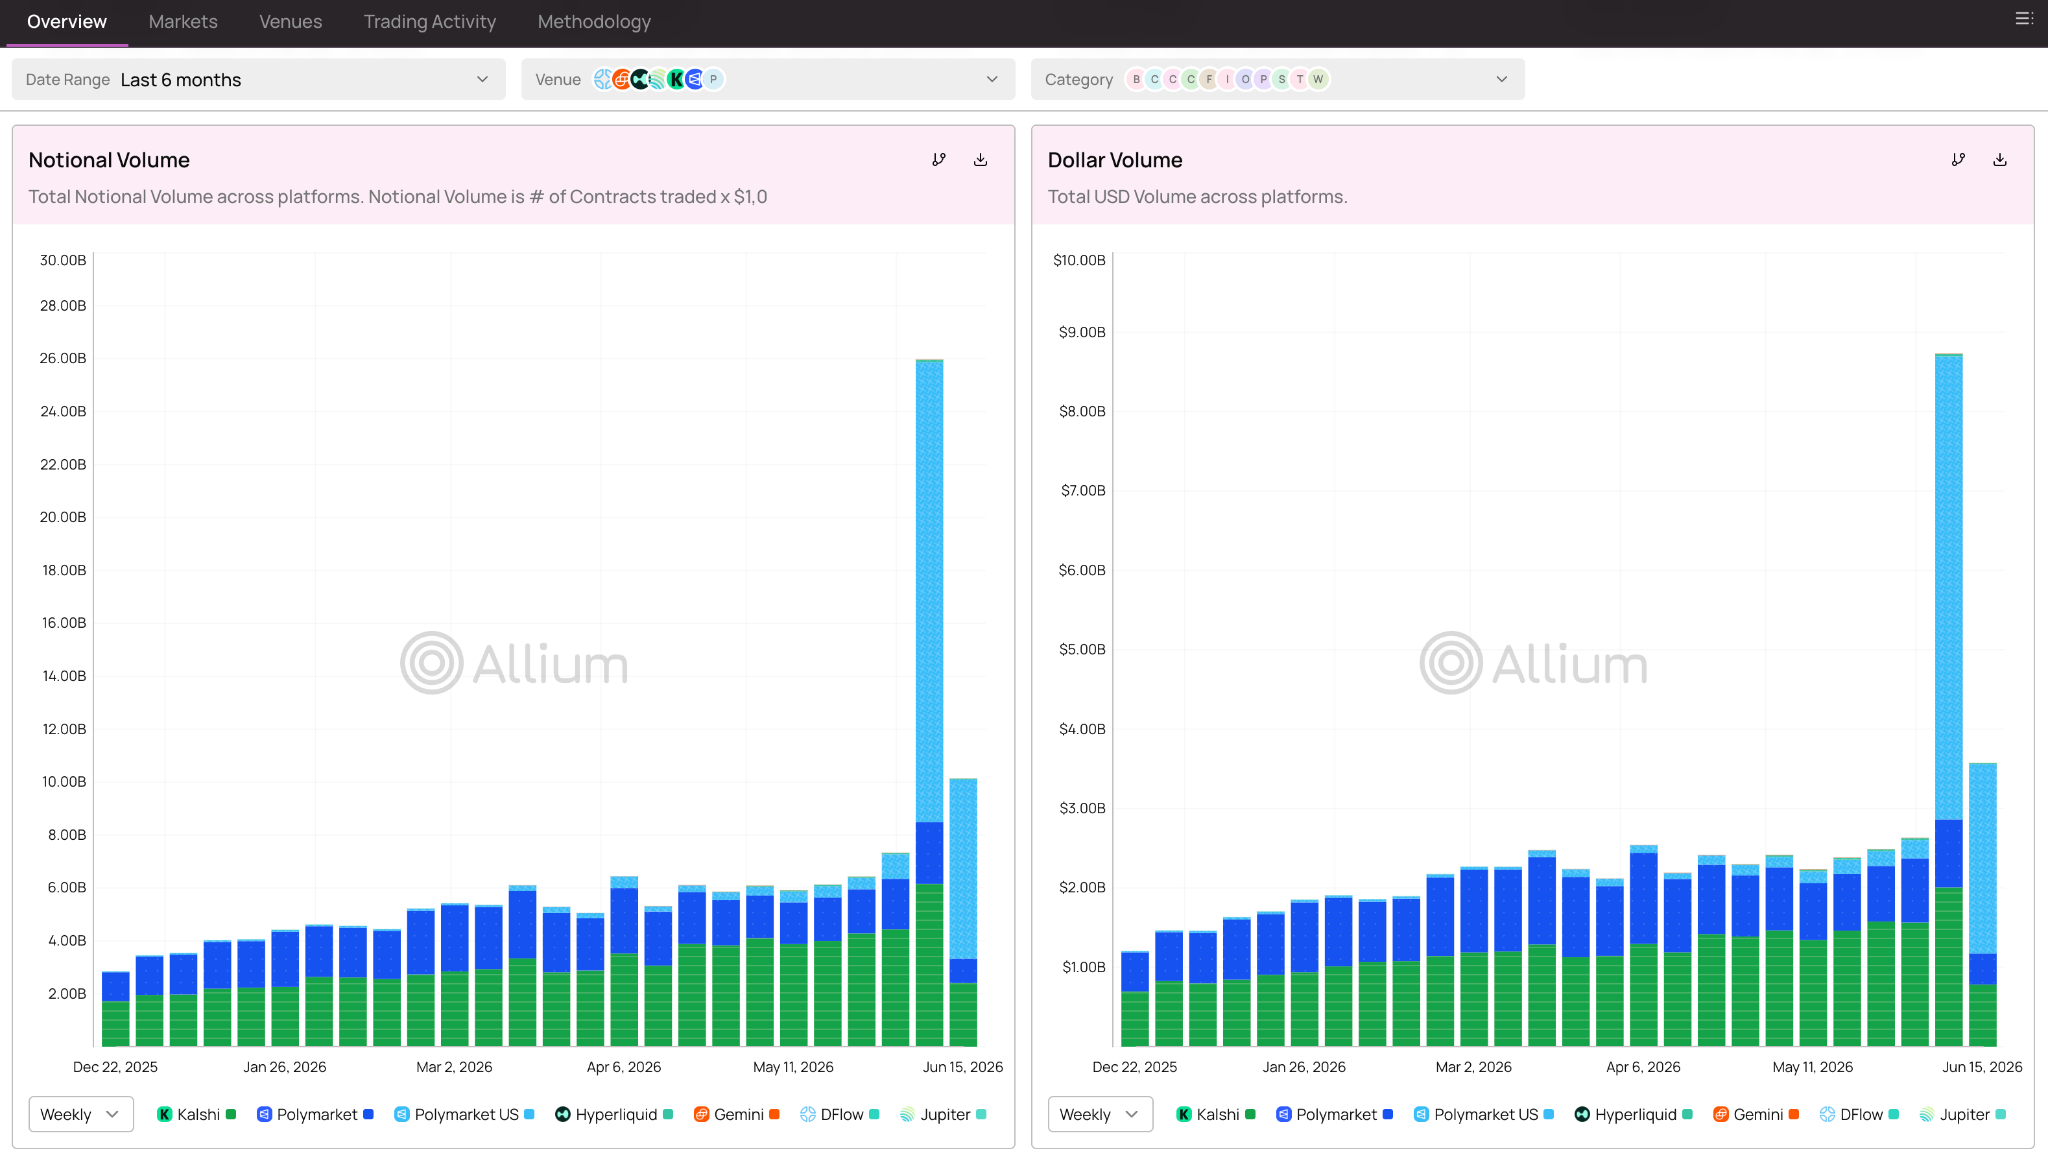
We’ve already played around with looking at different date ranges, but now you can use the date range filter to analyze how open interest has progressed over time. The date range at the top of the page will update all charts simultaneously: you can start by narrowing it to the last three months, and then the last six months, and note the difference in open interest.
The notional volume and dollar charts below the open interest chart add trajectory context for trading activity over the same period — useful for seeing whether volume and open interest are moving together or diverging.
What's the Difference Between Trading Volume and Open Interest?
Step 5: Compare conviction vs activity
Volume and open interest measure different things, and Allium Terminal surfaces both in ways that make the contrast clear.
The easiest way to think about it is that volume tells you how much people are trading, and open interest tells you how much money is still at stake.
On the overview tab, the notional volume chart shows how much trading happened.
On the venues tab, the collateral composition donut shows something different: how much money is currently locked in unresolved positions across platforms.
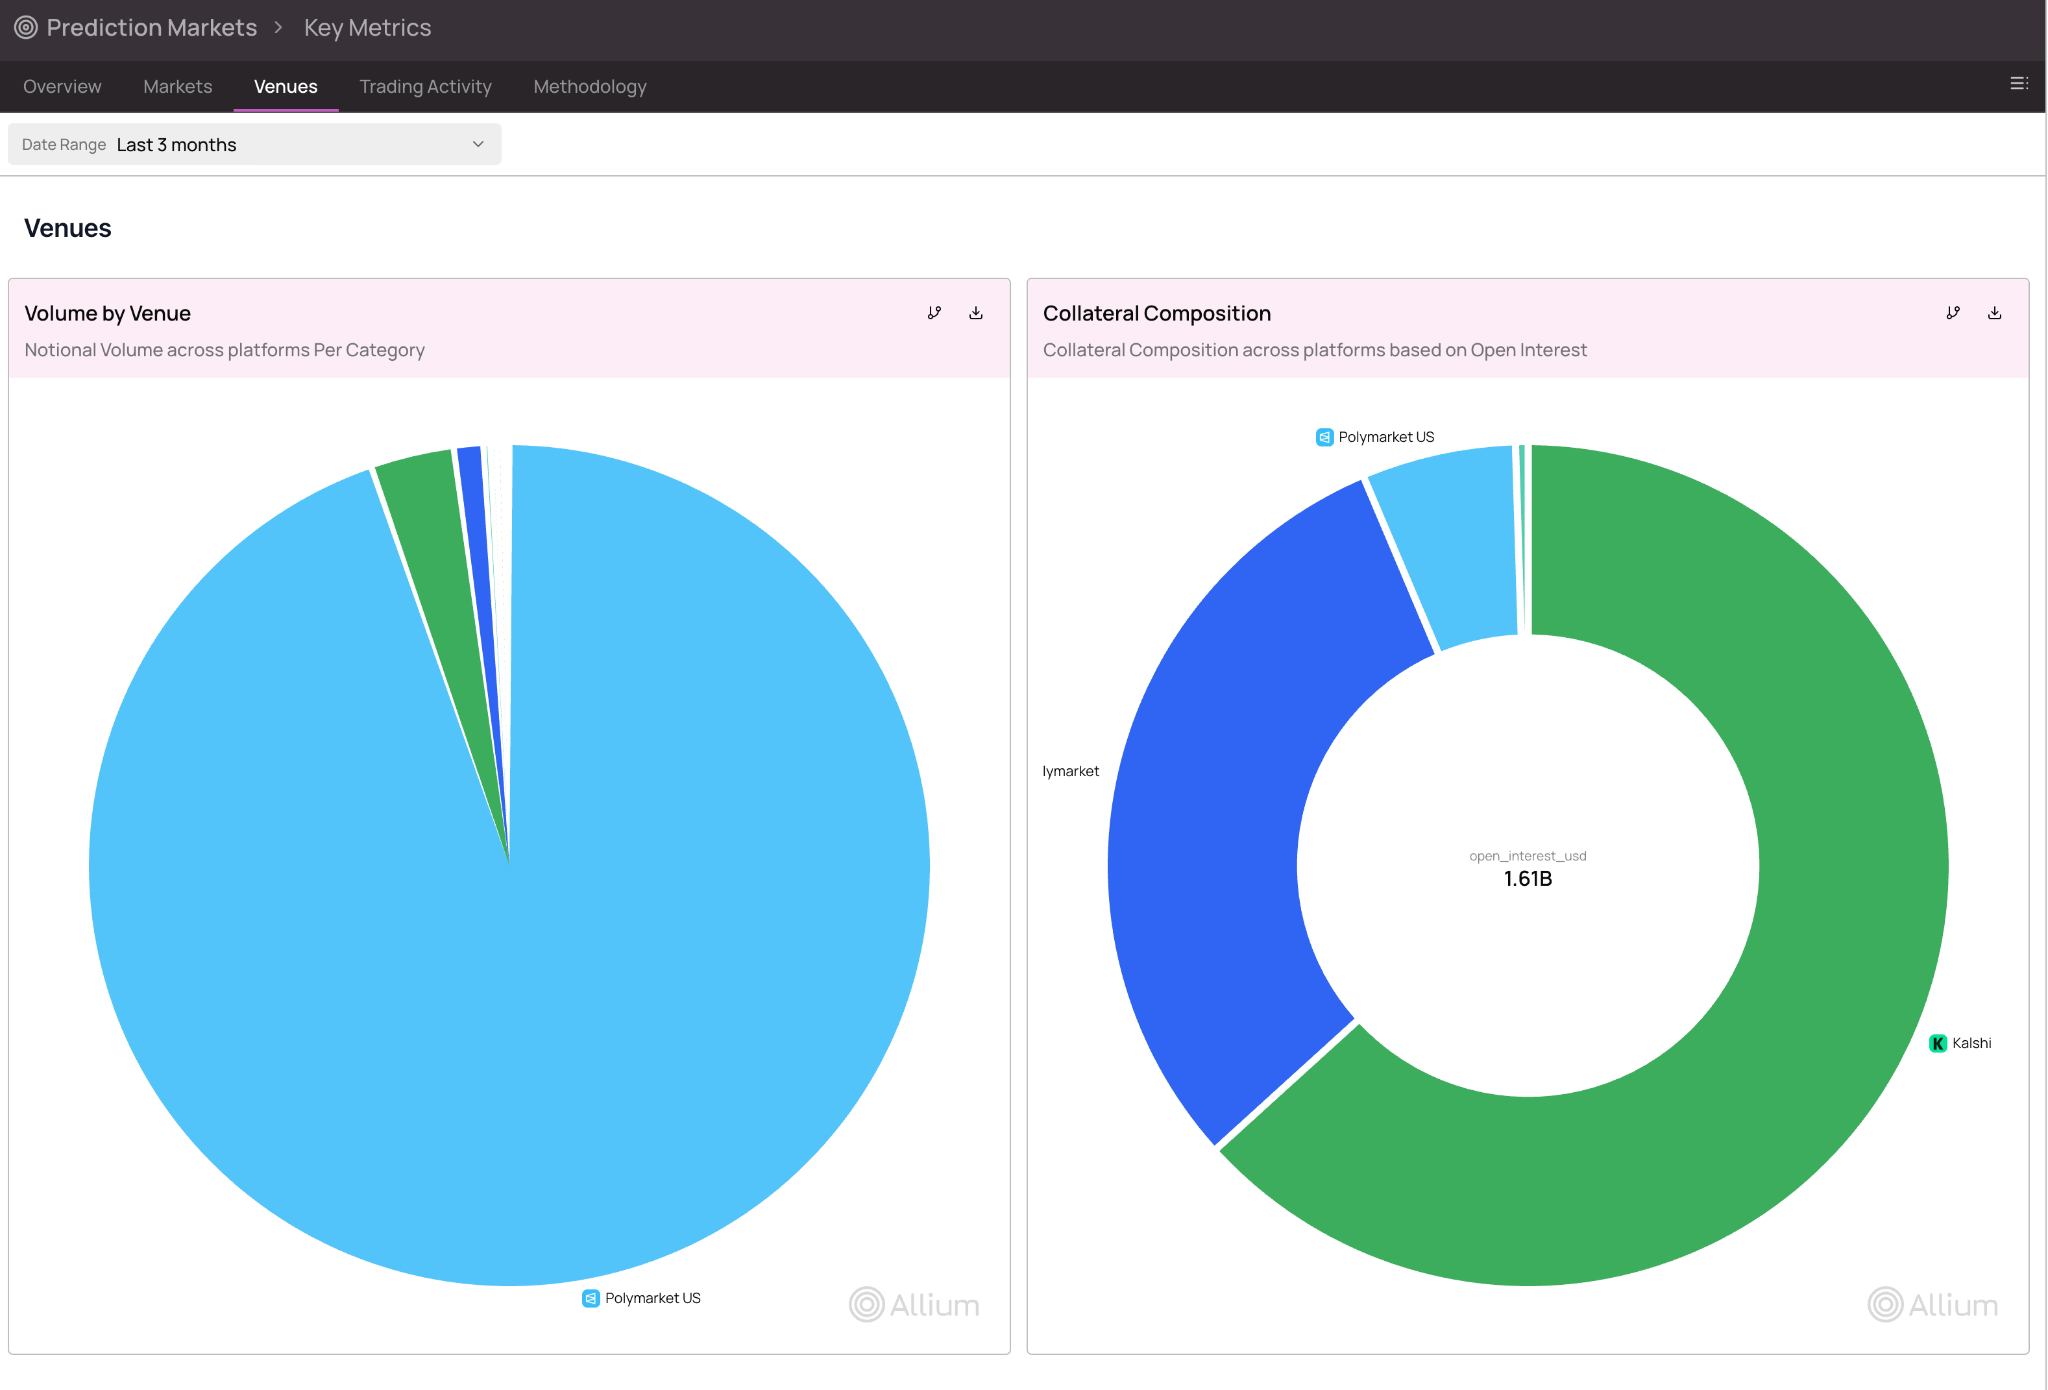
If all markets froze right now, where is capital actually sitting? According to the chart over the last three months, Kalshi holds the majority of open interest with $1.02B, Polymarket holds $488.5M, and Polymarket US has just $91.6M, despite Polymarket’s outsized volume contribution. The volume by venue pie chart on the venues tab sits directly alongside the Collateral Composition donut — comparing the two makes the divergence immediately visible.
Think of it like two casinos. One has people constantly buying and selling chips all day. The other has fewer transactions, but much larger bets sitting on the table. The first wins on volume, and the second wins on open interest. That's the relationship that Allium Terminal reveals between Polymarket and Kalshi.
What Can Open Interest Tell You About Polymarket and Kalshi?
Every analyst will be looking for something specific, but there are two obvious takeaways from Allium Terminal’s prediction markets data.
- Polymarket leads on volume — Polymarket dominates raw notional and dollar volume
- Kalshi leads on open interest — more capital is deployed in unresolved positions on Kalshi, which reflects its market mix and regulated userbase
The open interest divergence reflects the underlying difference in market structure. Kalshi’s CFTC-regulated, USD-collateralized model attracts users who hold their positions; Polymarket's non-US base generates more active secondary trading. If you only compare the volume between the two, you will miss this entirely.
FAQs About Polymarket and Kalshi Open Interest
What is open interest in prediction markets?
Open interest is the total value of capital currently committed to unresolved prediction market positions. Unlike trading volume, (which measures activity), open interest measures how much money remains at risk until markets resolve.
What is the difference between open interest and volume?
Volume measures how much trading occurred over a period of time. Open interest measures how much capital is currently deployed in active positions. A market can have high volume and low open interest if contracts are traded frequently, or high open interest and lower volume if participants hold positions for longer periods.
Does Polymarket have more open interest than Kalshi?
Not currently. According to Allium Terminal data, Kalshi holds more open interest than Polymarket, meaning more capital is committed to unresolved positions on Kalshi. Polymarket, however, generates higher trading volume.
Should Polymarket US be combined with Polymarket?
No. Polymarket US and Polymarket operate under different regulatory frameworks and offer different sets of markets. Combining them can overstate Polymarket's overall footprint and distort comparisons with Kalshi or other venues.
What prediction market categories have the most open interest?
Politics consistently represents the largest share of open interest across prediction markets. Sports, economics, and crypto markets also contribute meaningful open interest, though their share varies over time depending on major events and market cycles.
Why is open interest important for comparing prediction markets?
Open interest provides a clearer view of where capital is actually deployed. While volume shows trading activity, open interest reveals how much conviction remains in the market. For analysts comparing platforms, open interest is often the better measure of market depth and capital commitment.
Where can I track prediction market open interest?
Allium Terminal's prediction markets dashboard tracks open interest, volume, active users, market categories, and venue-level activity across Polymarket, Polymarket US, Kalshi, and other major prediction market platforms using a consistent methodology.