Stablecoin Data on the Bloomberg Terminal: What RWAS <GO> Shows
Bloomberg launched a stablecoin dashboard on the Terminal powered by Allium data. What it covers, how often it updates, and why supply figures differ by $44B.

Bloomberg has launched a stablecoin dashboard on the Bloomberg Terminal, available to all Terminal users at RWAS <GO>. Allium supplies the underlying dataset. Bloomberg's own on-screen attribution reads "Calculated by Bloomberg from Allium data and refreshed hourly."
Stablecoins now account for more than $300 billion in circulating supply and have become core infrastructure connecting digital asset markets to traditional finance, from settlement and cross-border payments through to demand for short-dated US Treasuries. Until now, tracking that activity meant working across a patchwork of blockchain explorers and analytics sites.
What the stablecoin dashboard shows
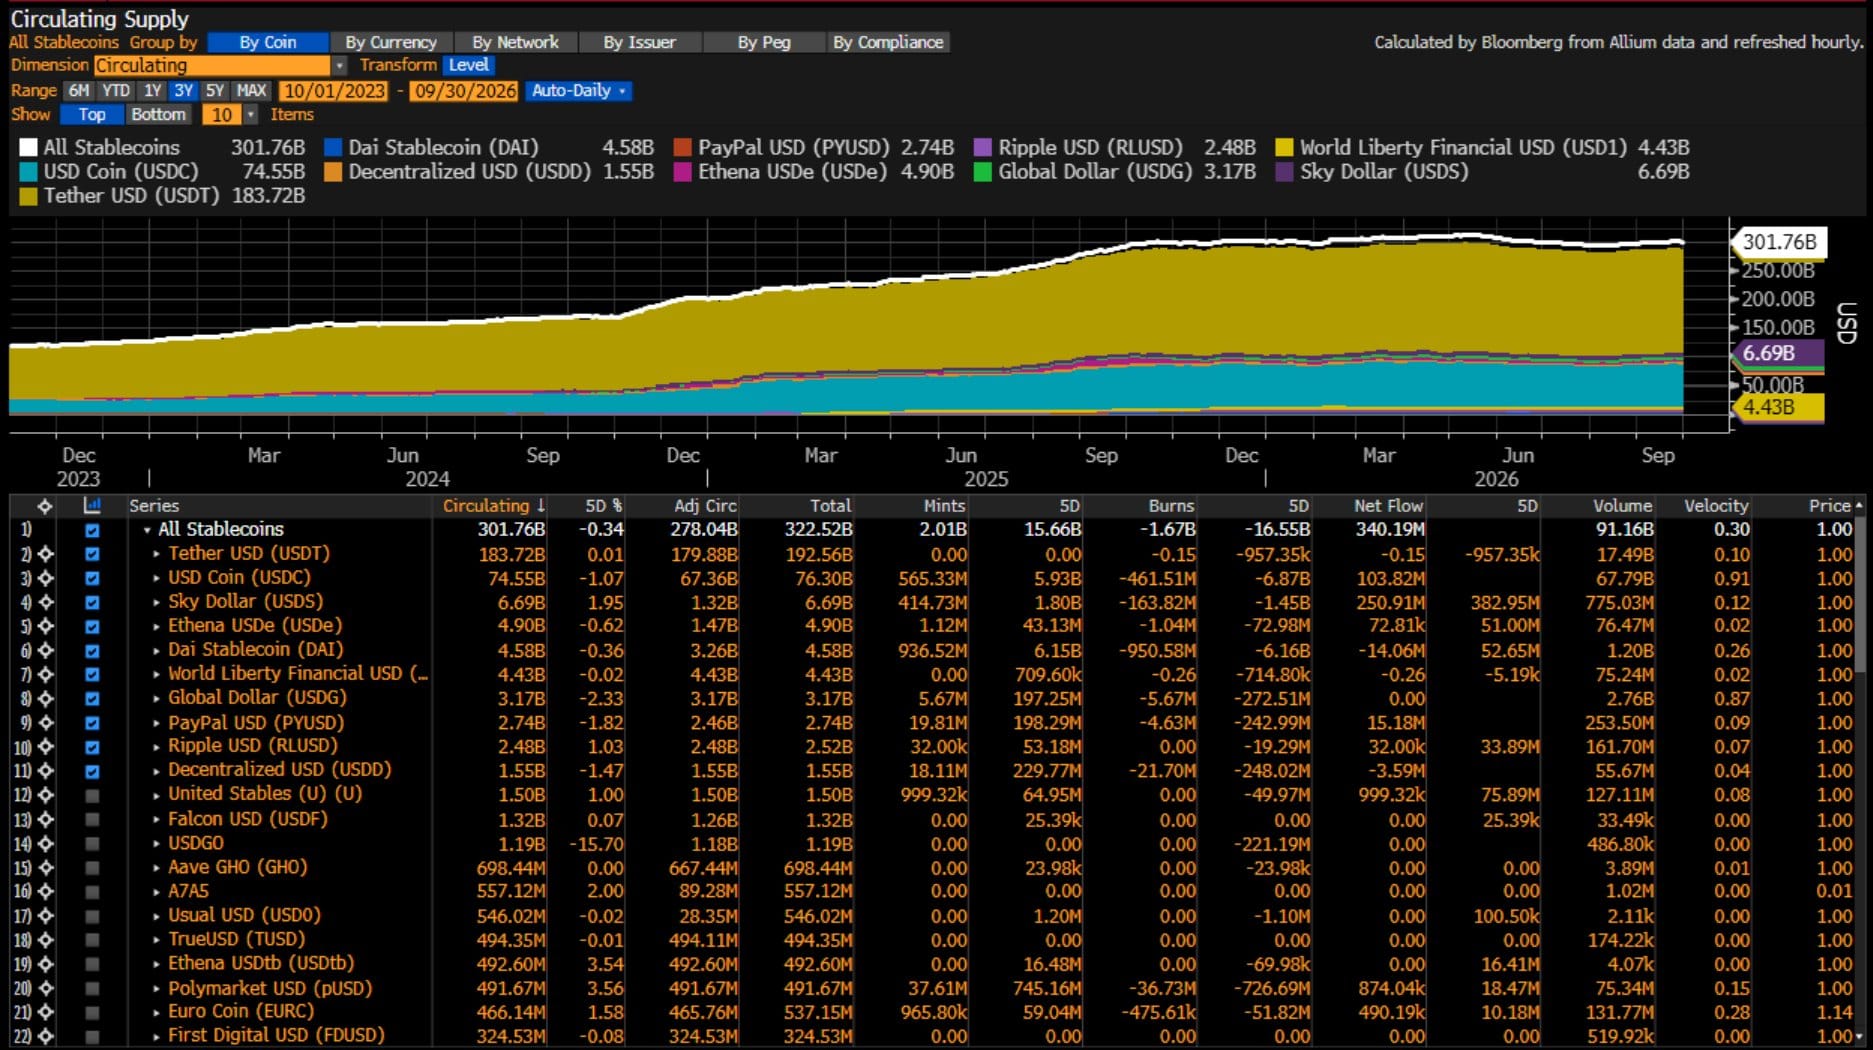
Every covered stablecoin, side by side, with circulating supply, adjusted circulating supply, total supply, mints, burns, net flow, volume, velocity and price, with five-day changes on circulating supply, mints, burns and net flow.
At the top of the table sits the aggregate. As of 30 September 2026 that read $301.76B circulating across all stablecoins, with Tether at $183.72B and USDC at $74.55B.
You can group the whole market six ways
By coin, by currency, by network, by issuer, by peg and by compliance.
Filtering by peg separates dollar stablecoins from euro and commodity-backed ones. Grouping by issuer rolls up an issuer's full footprint rather than one ticker at a time, which is the view most mandates actually need.
Three different answers to "how much stablecoin supply is there?"
This is the part most stablecoin data gets wrong, and on this dashboard it is visible on the screen.
| Measure | 30 September 2026 |
|---|---|
| Total supply | $322.52B |
| Circulating supply | $301.76B |
| Adjusted circulating supply | $278.04B |
A $44 billion spread between the widest and narrowest measure of the same market, on the same day.
The gap is everything the naive number quietly includes: tokens held by the issuer, bridged representations counted twice, locked collateral. Which figure is correct depends on the question being asked. Sizing Treasury demand is not the same question as sizing payment capacity, and the two take different denominators.
Our methodology is documented so a client can interrogate it rather than take a number on trust. That is the bar institutional desks apply to every other dataset they use.
How often the data updates
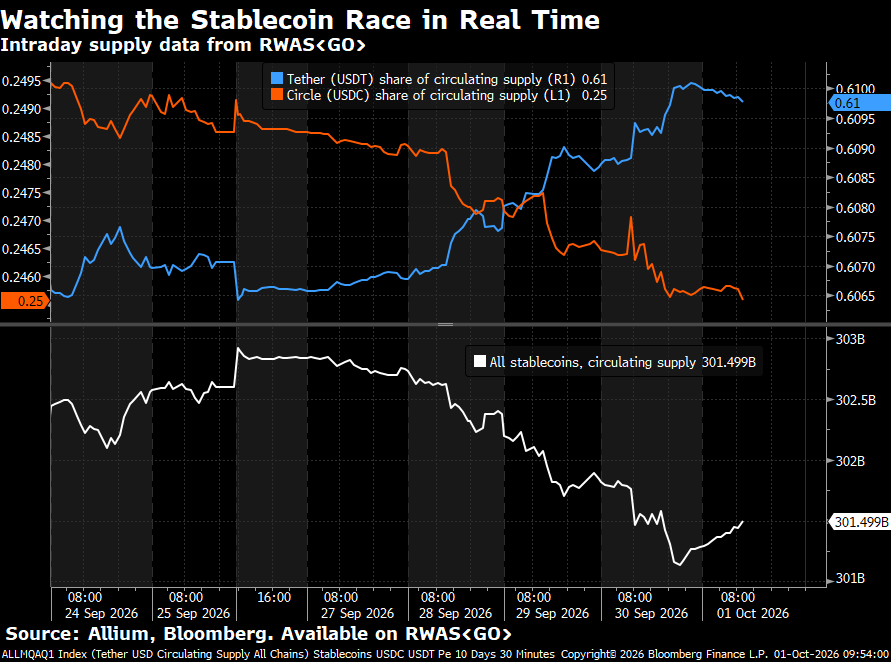
Current data updates hourly. Historical series update daily. Intraday supply is charted, so a redemption wave or a supply migration between chains is visible the same day rather than the next.
How to find it on the Terminal
Type RWAS <GO>. It is available to all Terminal users.
Which stablecoins are covered
Every stablecoin with more than $100 million in circulating supply, which collectively represents more than 98% of the market, plus a selection of smaller and non-US-dollar-pegged stablecoins.
Coverage is maintained rather than fixed. Stablecoins that cross the supply threshold get added, as do new networks for existing issuers.
What the same dataset shows about stablecoins right now
The dashboard runs on the dataset behind our research. Our September State of Stablecoins and Payments report found:
- $85 trillion of raw stablecoin transfer volume in the first eight months of 2026, of which $4.0 trillion was real economic activity once exchange-internal, DeFi and infrastructure transfers were removed
- Payment volume reached at least $401 billion, up 42% year on year, while supply grew only 6%
- Business-to-business settlement is the largest single payment lane
- Cross-border stablecoin payments are growing roughly seven times faster than conventional fiat rails
Frequently asked questions
Does the Bloomberg Terminal have stablecoin data?
Yes. Bloomberg launched a stablecoin dashboard at RWAS <GO>, powered by data from Allium, covering supply, mints, burns, transfer volume and velocity.
What is RWAS <GO>?
The Bloomberg Terminal function for the stablecoin dashboard. It is available to all Terminal users.
Which stablecoins does it cover?
Every stablecoin above $100 million in circulating supply, more than 98% of the market, plus select smaller and non-US-dollar-pegged stablecoins.
How current is the data?
Current data updates hourly, historical data daily.
Why do different sources report different stablecoin supply figures?
Because supply has at least three defensible definitions. On 30 September 2026 the same market read $322.52B total, $301.76B circulating and $278.04B adjusted circulating. The difference is issuer-held tokens, bridged duplicates and locked collateral.
Can I get this data outside the Terminal?
Yes. Allium delivers stablecoin supply, activity and reference data directly. Talk to us.