
Investment Research
Publish research on numbers you can defend
Trace every figure in your report back to the chain. The same data behind BCG's and Visa's stablecoin research, within 0.000011% of node data.



See the onchain numbers behind your coverage before earnings
Of $176T in onchain volume, $17T is economic activity
Allium strips out intra-entity movement, routing, bots and wash trading. BCG's and Visa's stablecoin research uses the same methodology.

-$100T
Intra-entity money movement

-$43T
Pass through routing (DEX, bridges)

-$9T
BOT / HFT activity

-$4T
Smart contract internals

-$3T
Wash trading and spam

$176T
Unadjusted onchain volume

$17T
Allium adjusted volume
$448B
Total stablecoin supply actively in circulation across all issuers. The remainder sits in foundation treasuries, protocol reserves, and locked addresses.
83%
of classified stablecoin volume comes from consumer wallets. Allium classifies the sender and receiver behind every transfer.
$8B
of stablecoin payments is intra-region in APAC. See geographic flows between every region and country on Allium.
Trace every figure to node data and every flow to an entity
Without Allium
Two platforms, two answers, and you can't trace either
Platforms disagree, figures can't be traced
You see the money move, but not who moved it
Attribution stops at the protocol
A new chain launches and your research has a blind spot
Coverage gaps and methodology that gets challenged
Figures within 0.000011% of blockchain node data.
Measured by KTH Royal Institute of Technology. One documented methodology on every chain, indexed directly from nodes.
Know who is behind every flow.
Sender and receiver type classified behind every transfer: institutional, retail, exchange, fund and algorithmic.
New chains ingested in under a week on average.
10,000+ protocols on SOC 1 and SOC 2 Type I and II certified pipelines.

September 15, 2026
State of Stablecoins and Payments: September 2026
Stablecoin payments reached between $401 billion and $527 billion in the first eight months of 2026, up 42% to 63% on the previous year. Businesses receive 58% to 64% of all payments, while cross-border stablecoin payments are growing 7 times faster than conventional fiat rails.
July 30, 2026
Onchain: The New Alternative Alpha
Perpetual futures and prediction markets now trade real money around the events that move markets, from the SpaceX IPO to the US-Iran oil shock to Fed decisions. This deck collects ten case studies on where that signal shows up first onchain and how investors can read it, all built on Allium data.


January 31, 2026
Stablecoins: The emergence of a new payment rail
Payments, Geography, Liquidity, and Blockchain Infrastructure (2024–2026)
Stablecoins are no longer just trading collateral. They are becoming payment infrastructure. This report analyzes $300B+ in labeled payment volume across 10,000+ protocols by counterparty, geography and use case.
"The quality of tables makes it easy to create complex queries in just a few lines that would otherwise require hundreds of lines of code."

Matt Maximo
Research Lead, Grayscale
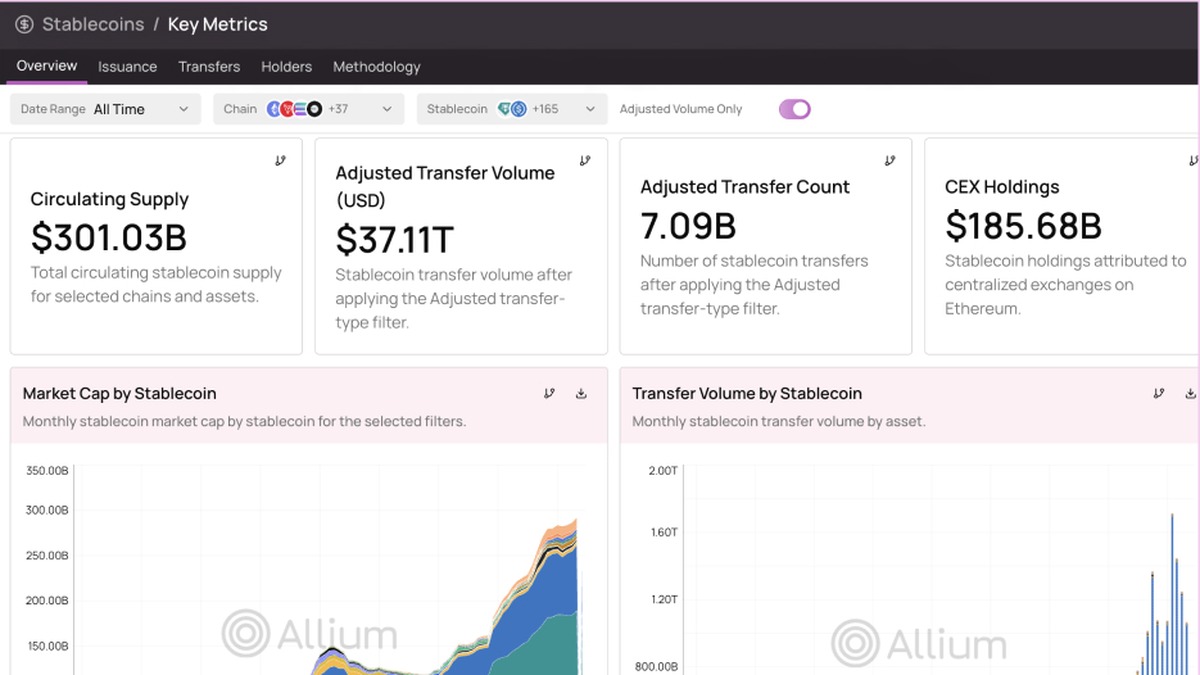
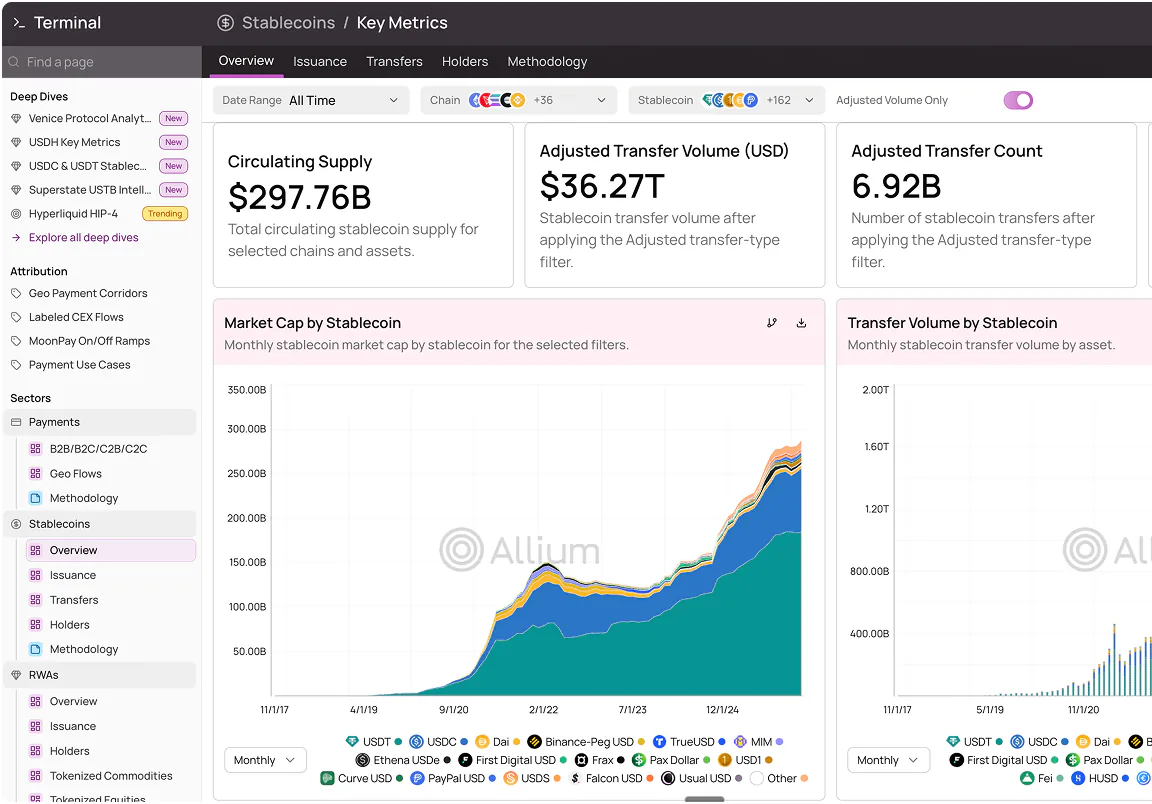
Allium Terminal
Size markets and track stablecoin, tokenized asset, and DEX activity without writing a query
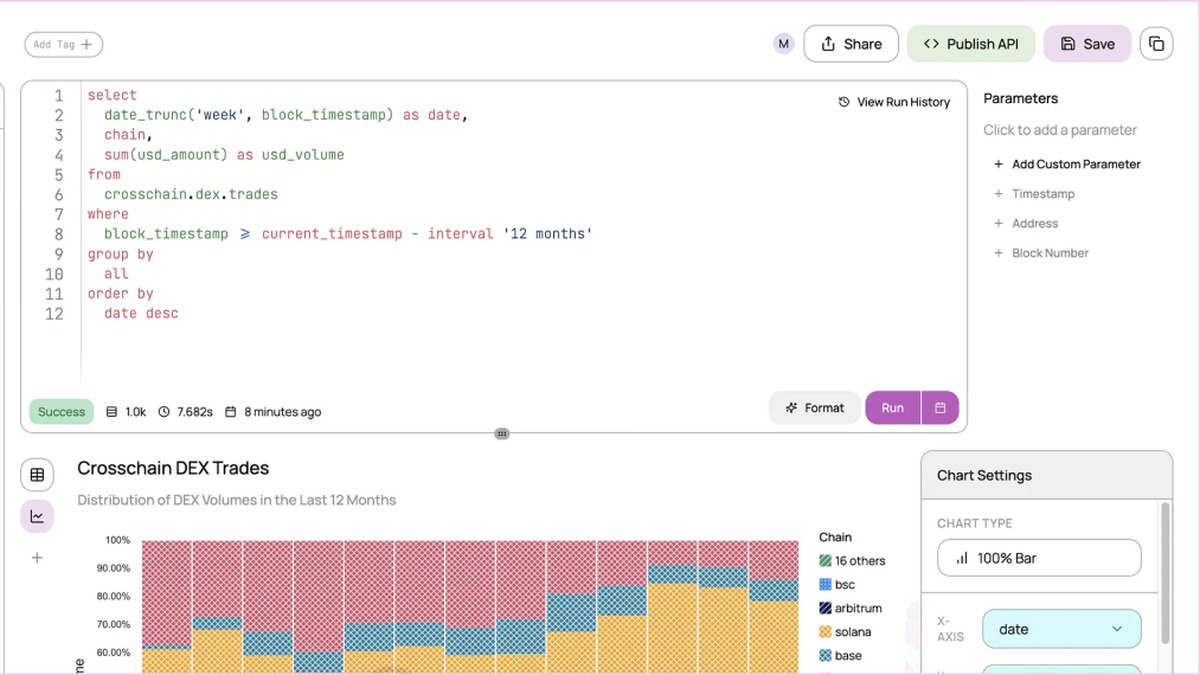
Explorer
Edit any Terminal chart or write custom SQL across 10,000+ protocols, then share the result with your team
Tell us what you cover. We'll show you the data behind it.
