How big is stablecoins' share of the cross-border payments market? The state of adoption in numbers
In an industry first, FXC Intelligence and Allium measure the true share of the cross-border payments market that moves on stablecoins.
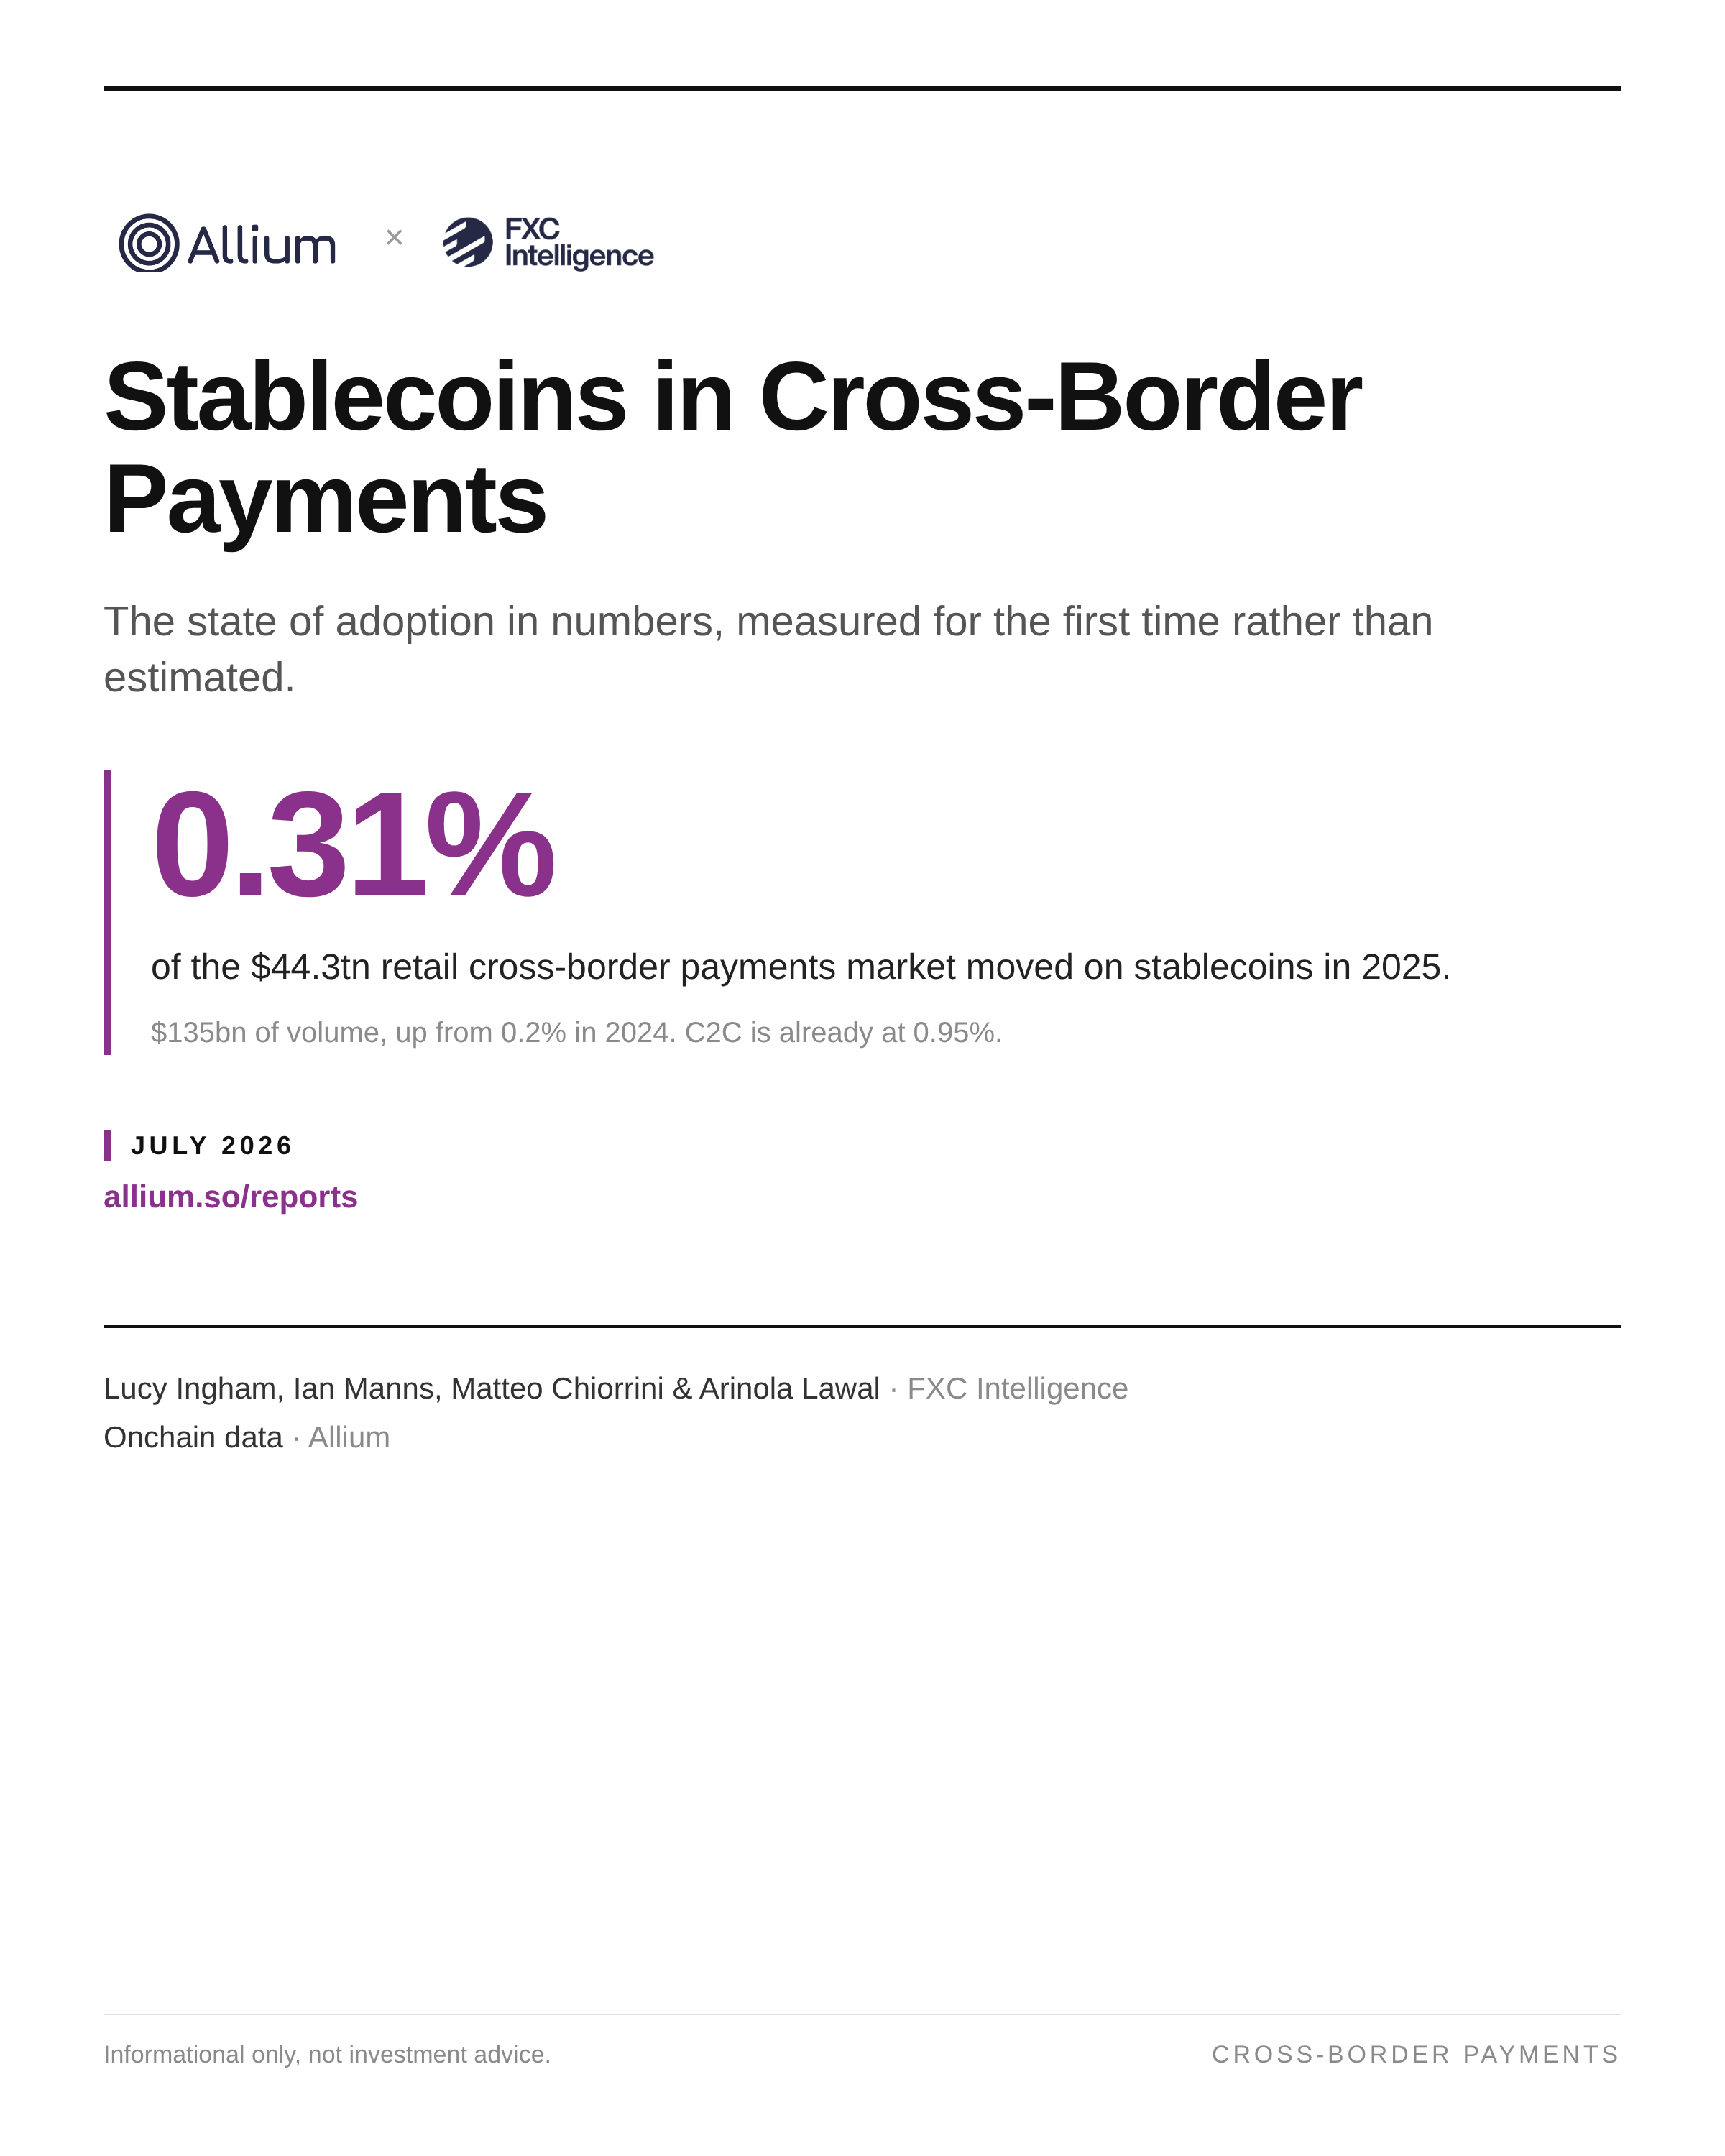
Raw stablecoin transaction volume is mostly non-economic activity, and what remains mixes domestic with cross-border, so the industry has been sizing stablecoin payments by rough estimate. This joint report with FXC Intelligence puts a number on it: $135bn of the $44.3tn of retail cross-border payments volume in 2025, 0.31% of the market, up from 0.2% in 2024. The share is far higher wherever consumers are involved. C2C runs at 0.95% and B2C at 0.89%, both on track to pass 1% in 2026, while B2B, the largest segment by far, sits at 0.19%. By Lucy Ingham, Ian Manns, Matteo Chiorrini & Arinola Lawal, FXC Intelligence With onchain data from Allium
Key takeaways
- Stablecoins moved $135bn of the $44.3tn retail cross-border payments market in 2025, 0.31% of volume. That is up from $82bn and 0.2% in 2024. Stablecoin cross-border volume grew 64% year on year against 9% for fiat.
- Adoption tracks consumer involvement, not size of segment. C2C is at 0.95% penetration and B2C at 0.89%, both close to the 1% mark, while B2B, which carries 79% of fiat cross-border flow, is at 0.19%. C2C is 15% of stablecoin volume against 5% of fiat, an over-index of about 3x.
- A handful of markets carry the flow, and they are not the leading fiat corridors. Taiwan to Turkey, Taiwan to Indonesia and Turkey to Indonesia together accounted for around 13% of all stablecoin cross-border payments in 2025. On the Mexico to US corridor the dominant direction of stablecoin flow runs opposite to traditional remittances, which points at demand for dollars rather than remittance.
Abstract
Stablecoins are now a standing topic in cross-border payments, but the industry has had no reliable measure of how much cross-border payment volume actually moves on them. Transaction volume headlines are dominated by non-economic activity, and the remainder mixes domestic with cross-border flow. This report, a first collaboration between FXC Intelligence and Allium, combines FXC Intelligence market sizing with Allium's Real-World Payments layer to size the stablecoin share of the retail, or non-wholesale, cross-border market for full-year 2025, with 2024 for growth.
Stablecoins accounted for an estimated $135bn of $44.3tn in 2025, 0.31%, against $82bn of $40.5tn in 2024. The headline hides a wide spread by use case. B2B is 79% of fiat cross-border flow but only 49% of stablecoin flow, and its penetration is 0.19%. C2C and B2C over-index at roughly 3x their fiat weight and sit at 0.95% and 0.89% penetration, close to crossing 1% in 2026. Growth is fastest in C2B at 72%, followed by B2B at 69%, B2C at 62% and C2C at 44%, against 9% for fiat overall.
Geography shows the same tilt. The top three corridors are Taiwan to Turkey, Taiwan to Indonesia and Turkey to Indonesia, about 13% of stablecoin cross-border volume between them, with Mexico, Ukraine and South Korea also ranking high. Two conditions explain most of it: FX, inflation and capital-control stress in Turkey, Ukraine, Mexico and Indonesia, and deep crypto-trading ecosystems in Taiwan and South Korea. Indexed against fiat, consumer-facing use is up everywhere, with B2C at 5.3x its fiat weight in APAC, 3.5x in EMEA and 1.4x in the Americas, while B2B under-indexes at 0.6x to 0.8x in every region.
Stablecoins remain a rounding error against the whole market, and the report is explicit that there is a long way to a level playing field with fiat. What the data shows is where adoption lands first: the segments and markets the traditional system serves least well.
Download the full report for the use-case and regional breakdowns, the corridor detail and the methodology.
Informational only. Not investment advice.
State of Stablecoins and Payments: September 2026
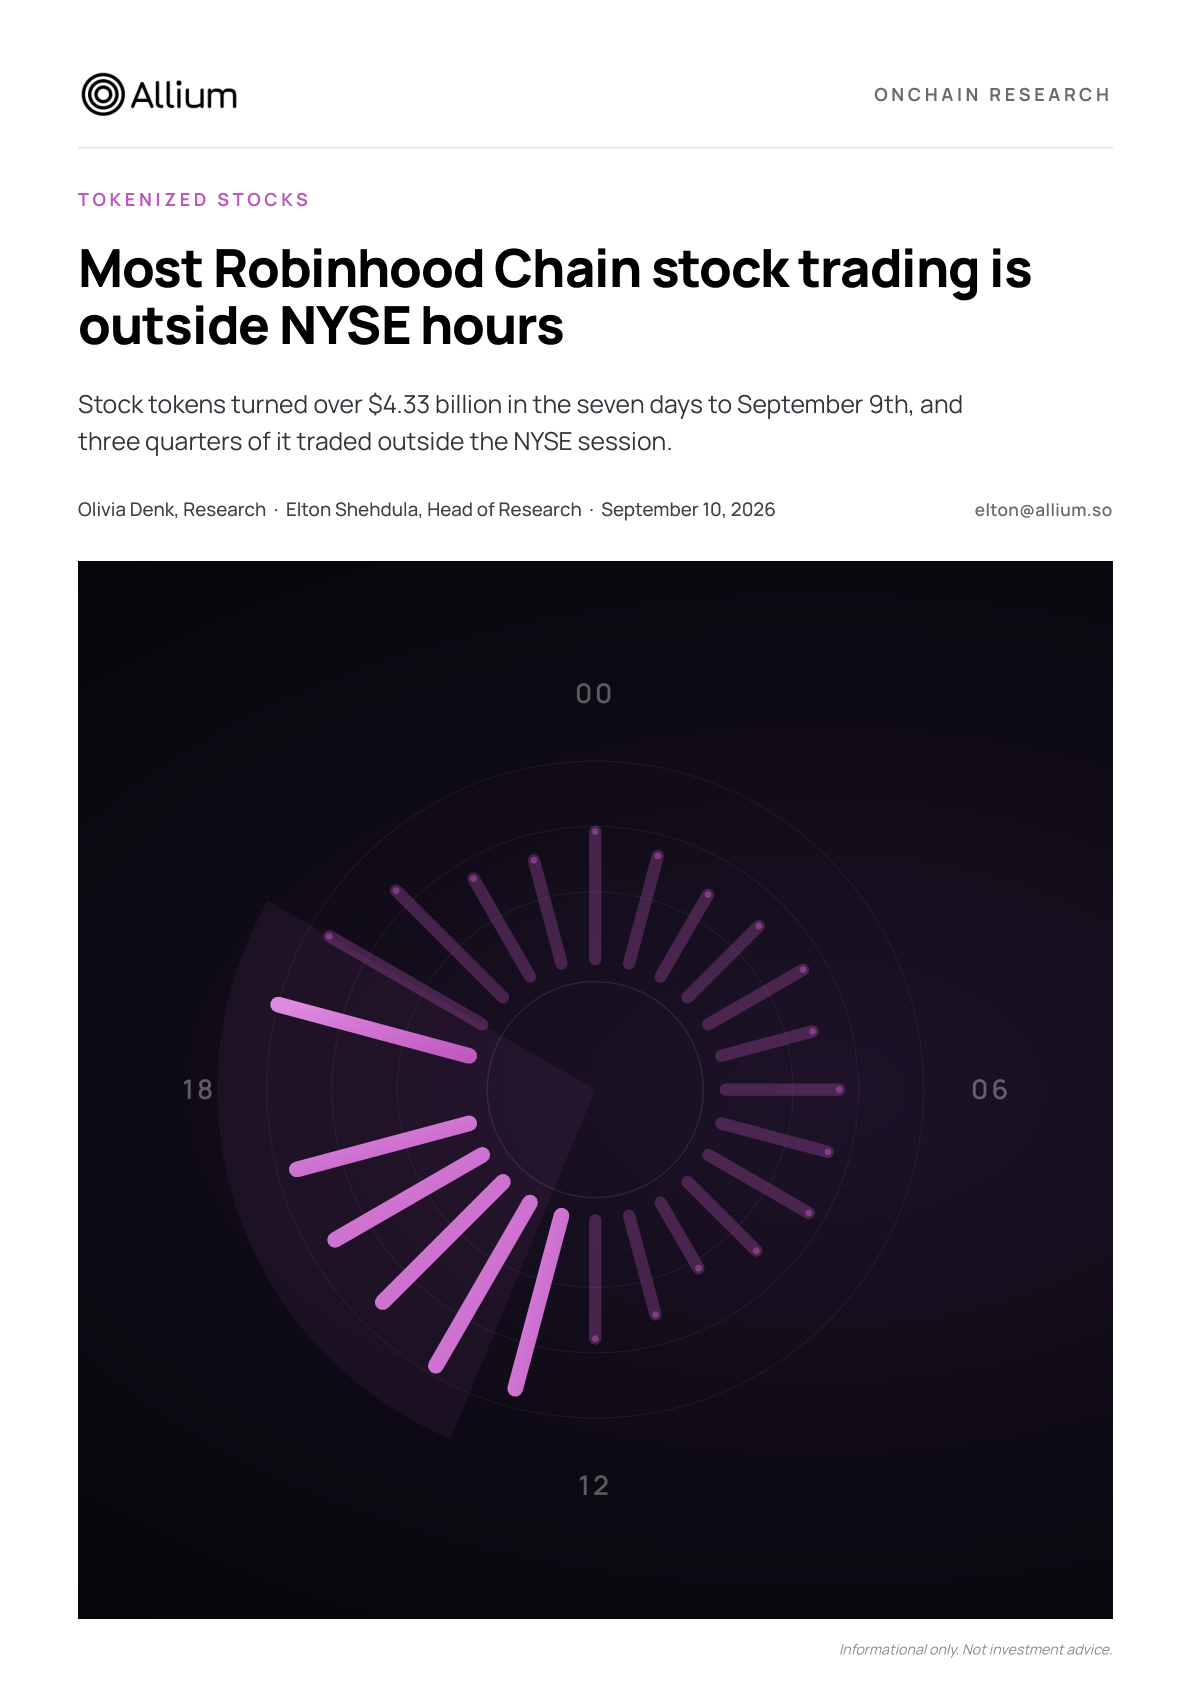
Most Robinhood Chain stock trading is outside NYSE hours
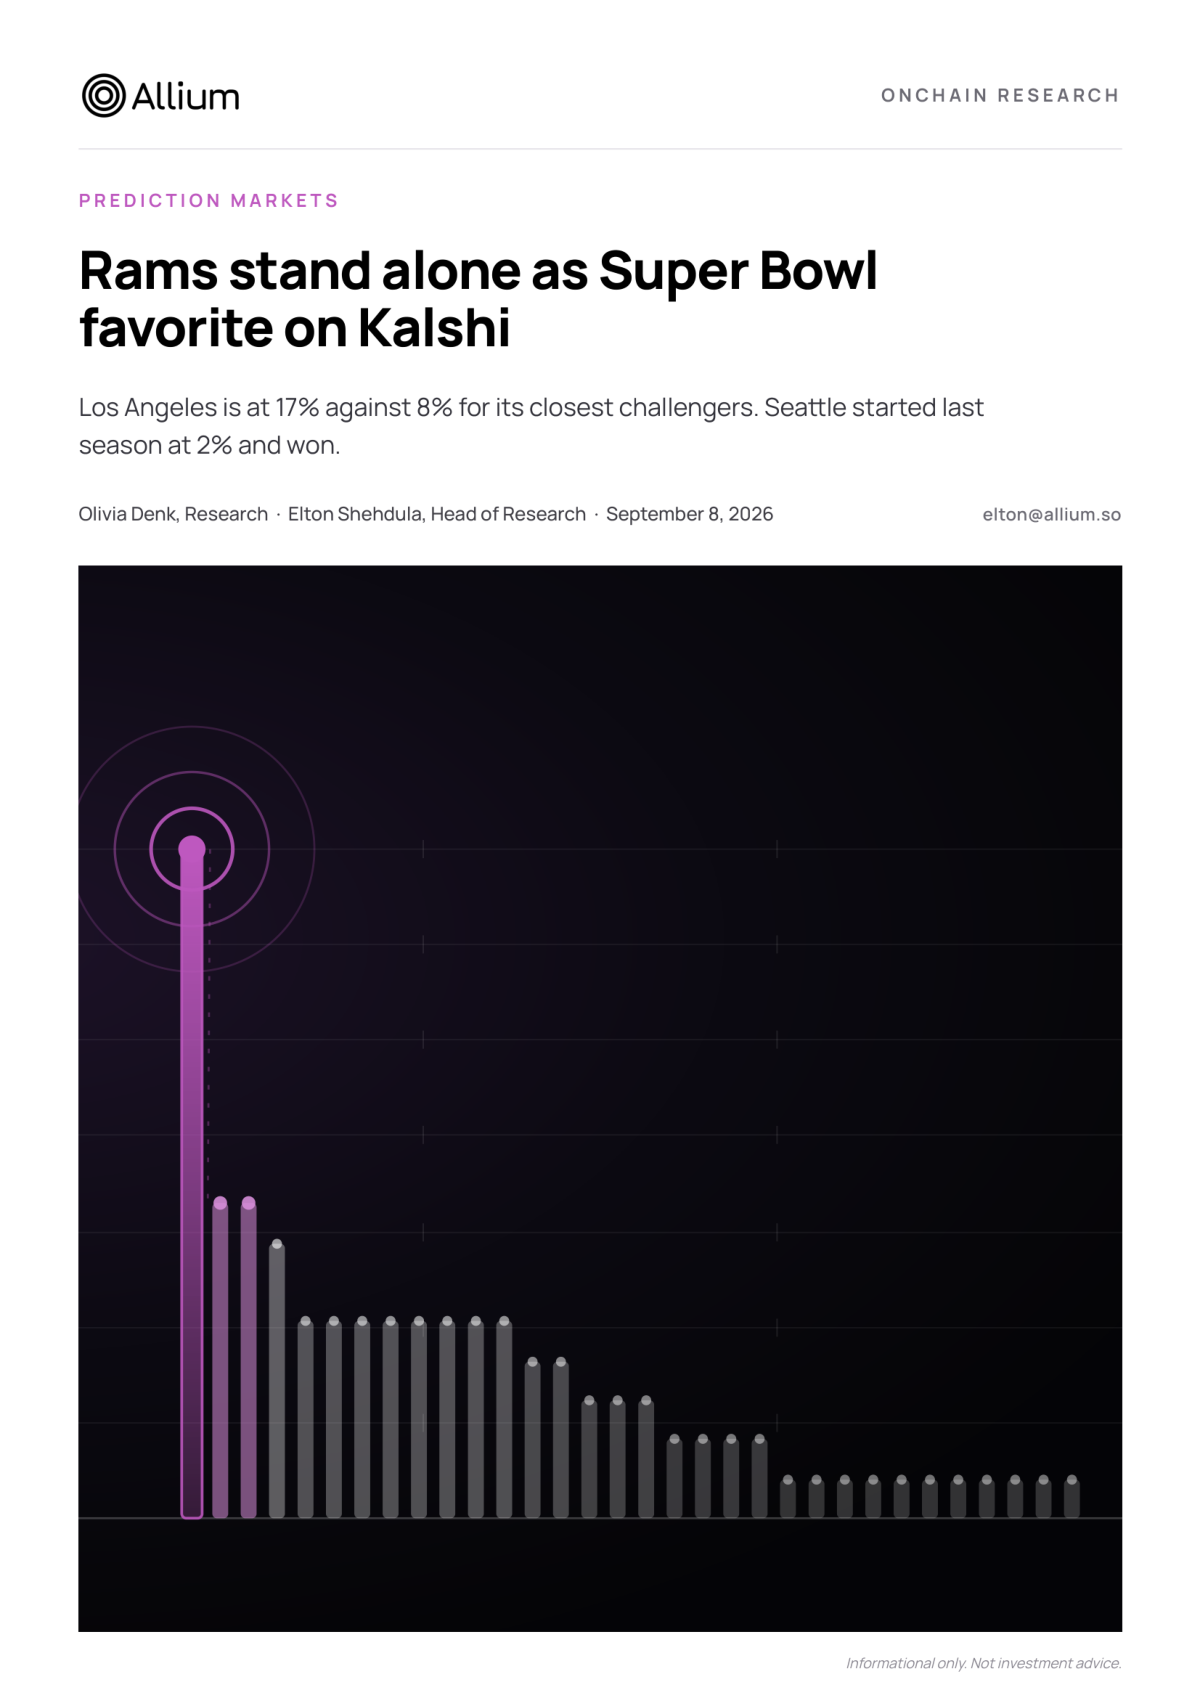
Rams stand alone as Super Bowl favorite on Kalshi
The State of the Solana Real-World Asset Ecosystem: August 2026
Pricing the $UNITREE IPO Before It Opens
Prediction markets moved before currencies in three elections
Circle's revenue rests on USDC supply which continues to fall into Q3'26
Stablecoins: Impact on U.S. Treasury Market
Polymarket and Kalshi now predict future GPU rental prices
Onchain: The New Alternative Alpha
A live market priced CXMT's 472% IPO pop before Shanghai opened

Gain exposure to Anthropic and OpenAI before the IPO

Binance's outflows shifted further to self-custody into the MiCA deadline
The most expensive long onchain is a crowded bet on SK Hynix
Which Company Will Be the World's Largest by Year-End 2026?
State of Onchain Finance Q2 ’26

Meeting in the Middle
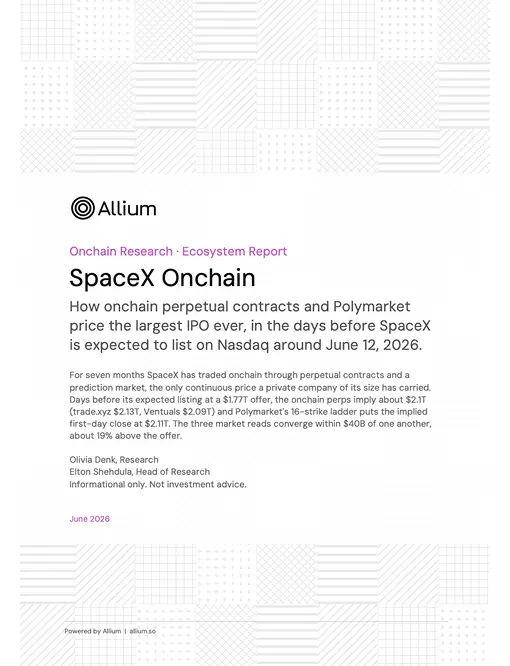
Pricing SpaceX Pre-IPO Onchain
.webp)
World Cup Prediction Markets Geography
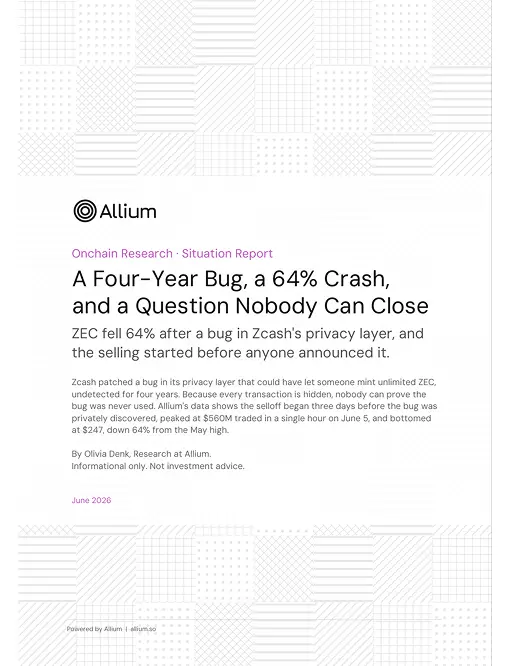
A Four-Year Bug, a 64% Crash, and a Question Nobody Can Close
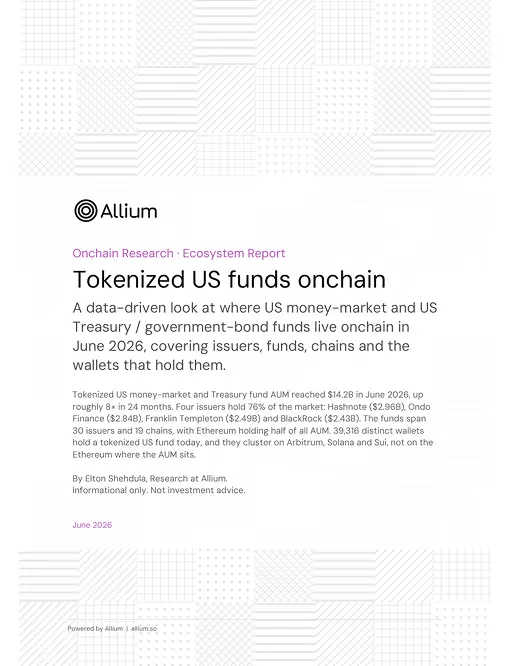
Tokenized US Funds Onchain: $14.2B and Compounding
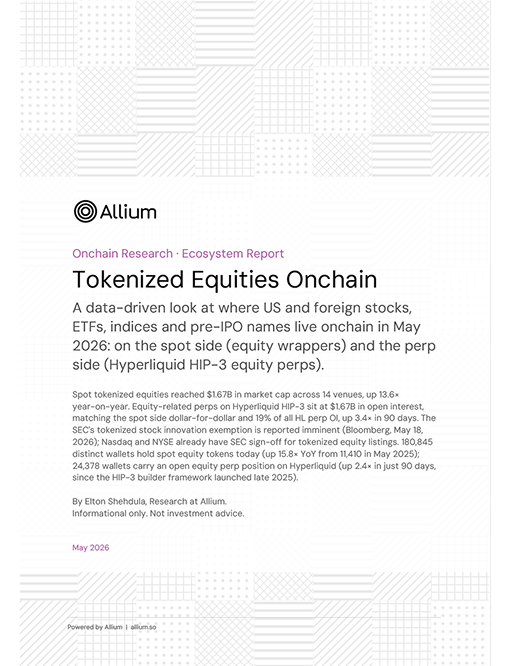
Tokenized Equities Onchain: $3.3B and Growing
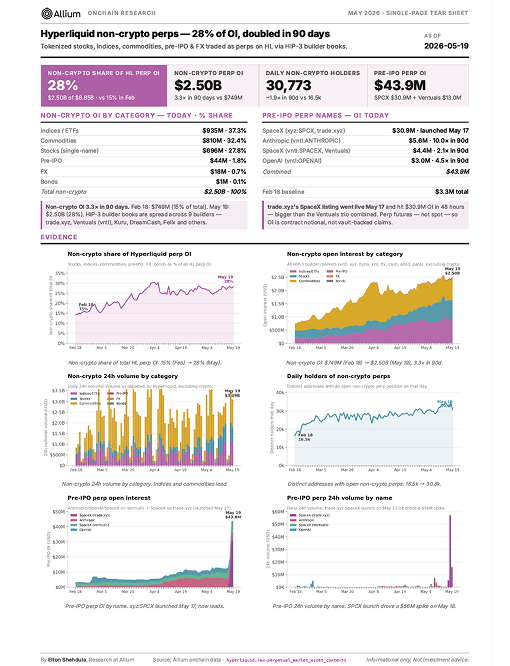
Hyperliquid non-crypto perps
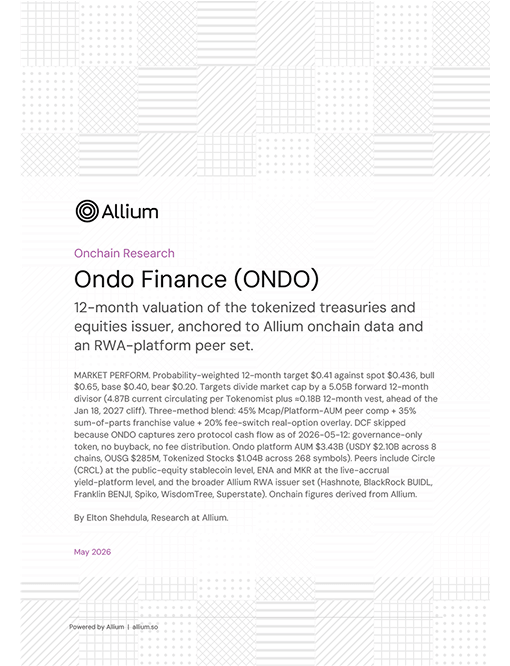
Ondo Finance (ONDO)
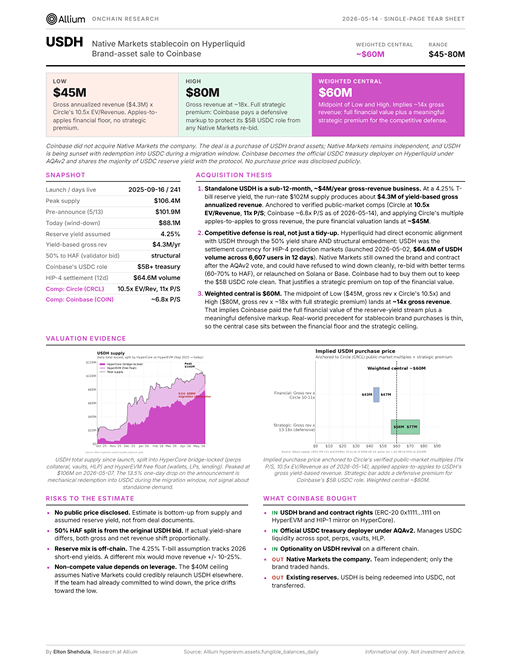
USDH: What Coinbase Actually Bought
When Wall Street Sleeps
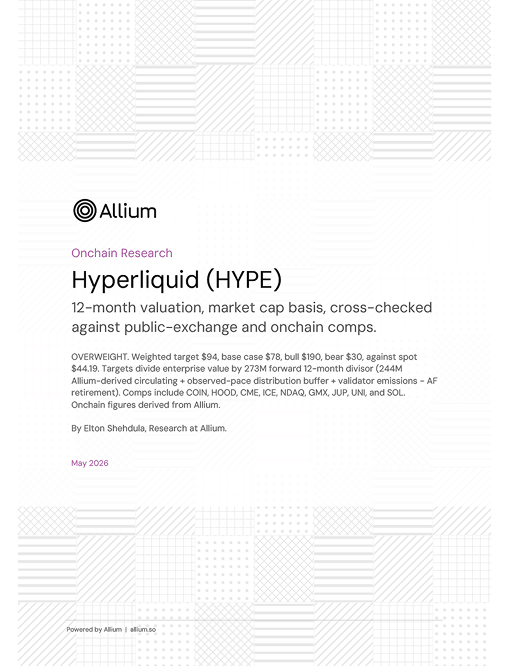
Hyperliquid (HYPE): Onchain Research
Franklin Templeton on Stellar: Onchain Analysis
Prediction Markets: A New Financial Primitive
Stellar: Institutional Infrastructure for Global Settlement and Tokenized Assets
Tokenized Equities: Market Adoption and Trading Dynamics
Stablecoins: The emergence of a new payment rail
Onchain Execution: How Institutions Are Trading in DeFi Markets
Stablecoin Payments: The Truth Behind the Numbers

In the Shadow of Bank Runs: Lessons from the Silicon Valley Bank Failure and Its Impact on Stablecoins
Cross-Chain Arbitrage: The Next Frontier of MEV in Decentralized Finance
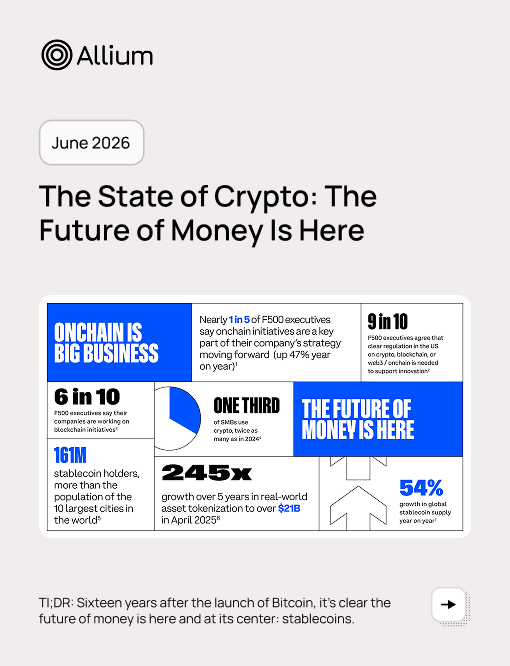
The State of Crypto: The Future of Money Is Here
Stablecoins: Five killer tests to gauge their potential
On-Chain Trading Data Gaps: Risks for Crypto Market Oversight
On-Chain Analysis of Smart Contract Dependency Risks on Ethereum
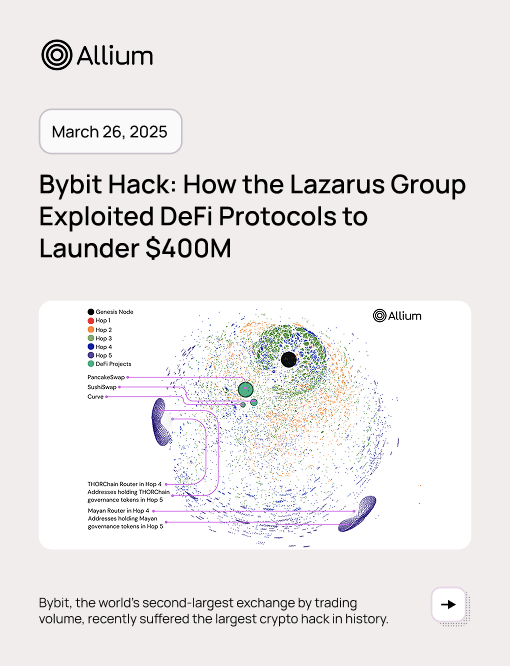
Bybit Hack: How the Lazarus Group Exploited DeFi Protocols to Launder $400M
Game Theoretic Liquidity Provisioning in Concentrated Liquidity Market Makers

Algorithmic Techniques for Utility Improvement Across the Blockchain Stack
Finance is moving onchain. Allium is the system of record it runs on.